Content:
1. Introduction and functional morphology of the heart
2. Formation, conduction and spreading of cardiac excitation, action potentials
3. Electrocardiogram (ECG)
4. Cardiac cycle, cardiac output, Frank-Starling mechanism
5. Function of cardiac valves
6. Control of cardiac activity
7. Energy metabolism of the heart
8. Heart as an endocrine organ
_
Introduction and functional morphology of the heart
The human heart, this remarkable effective unrelenting and reliable pump, can daily draw more than 6000 litres of blood continuously during the whole life. It beats 40 million times per year and so provides stabile delivery so vitally necessary nutrients and drainage of vestigial metabolites from organs and this all via pumped blood.
Functional morphology of the heart
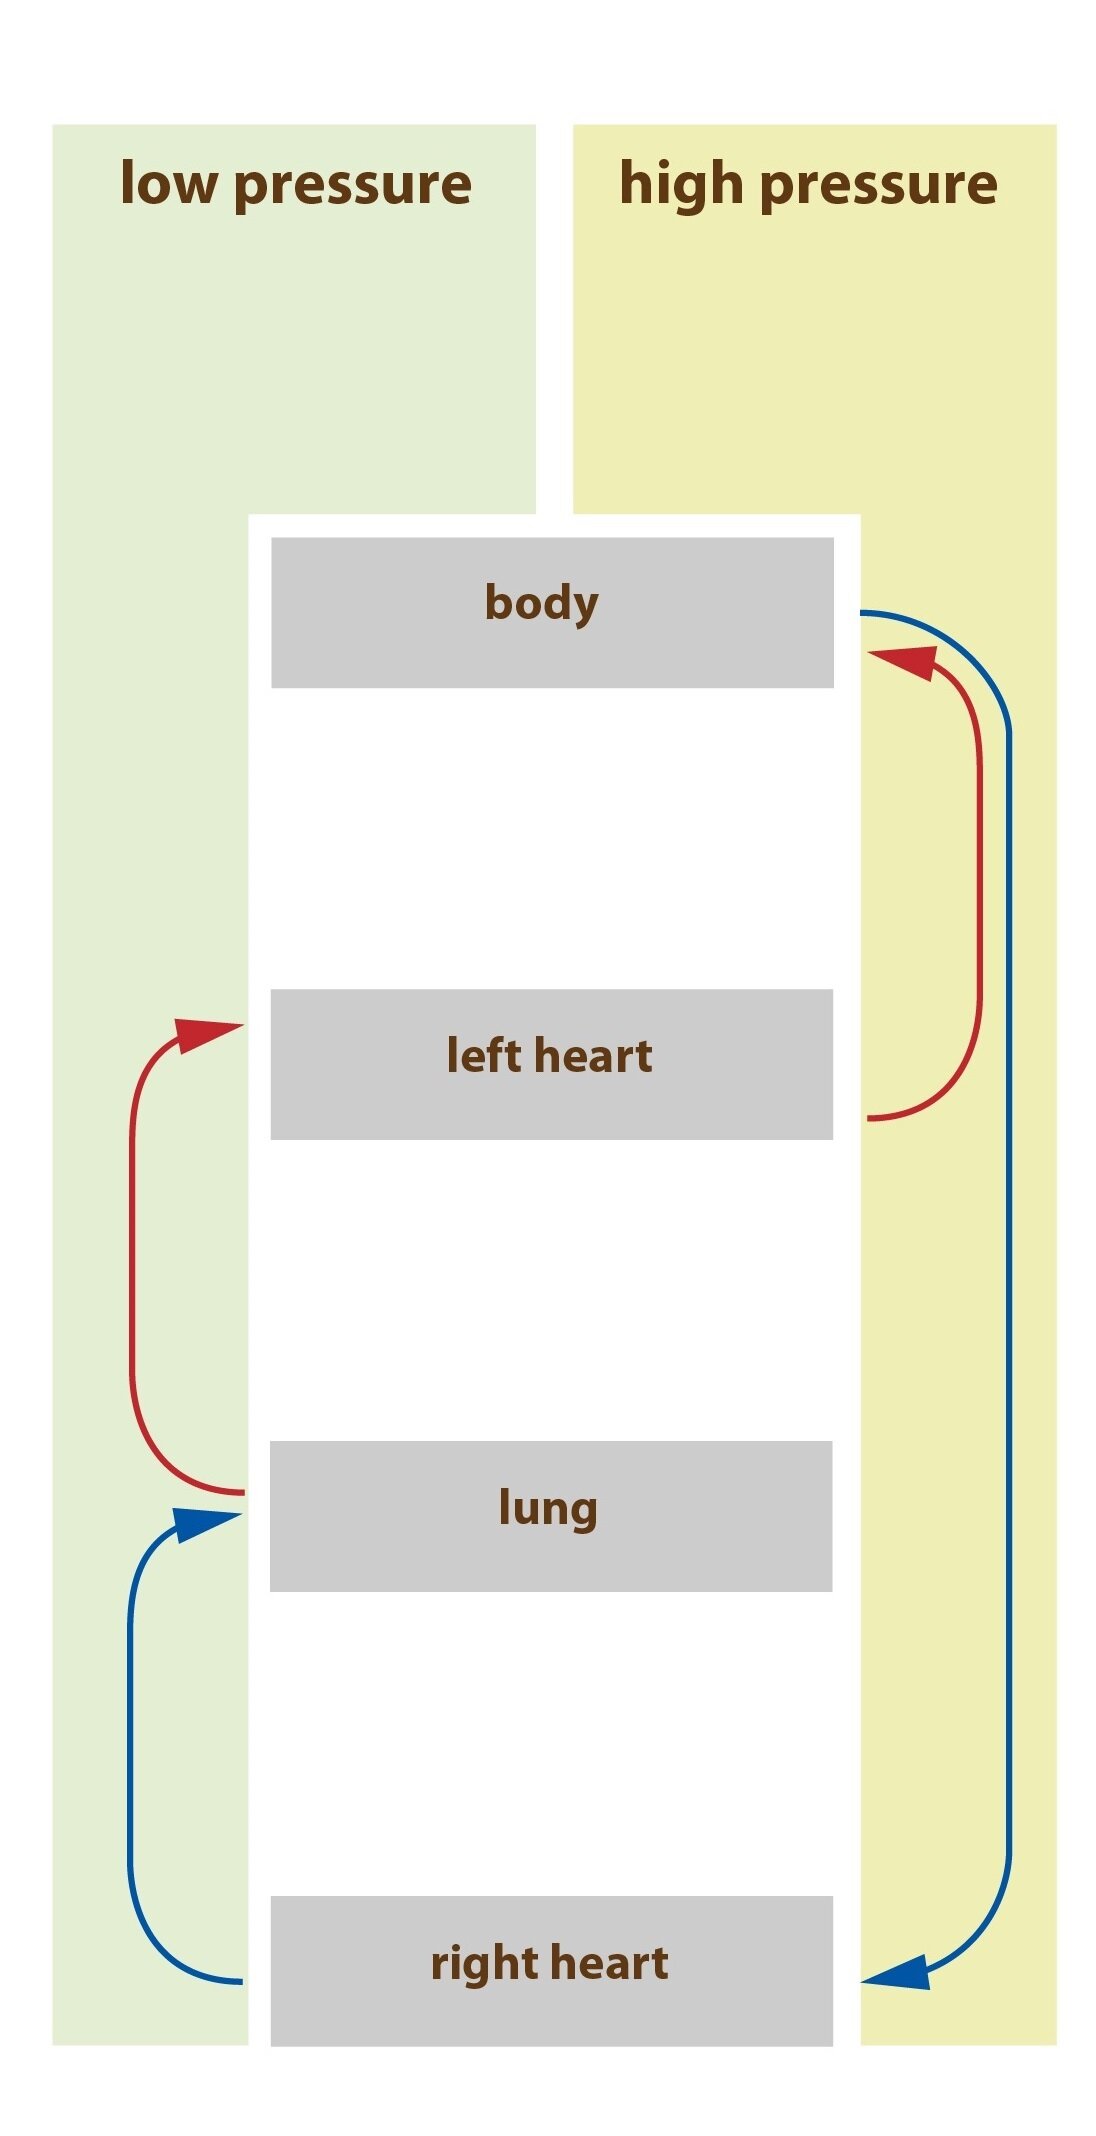
The heart constitutes two separated – serial attached – pumps: right heart pushing the blood to lungs, left heart pumping the blood to organs and periphery. Each of those parts of the heart is pulsatile two part serial attached pump consisting of an atrium and a ventricle. Heart atrias are pump which help to blood circulation to fulfill heart ventricles and these ventricles comprise the major source of power to transport the blood to the pulmonary circulation thanks to the right ventricle or to peripheral circulation thanks to the function of the left ventricle.
The whole organ lies in an closed serosal cavity = in an wrapping called pericard. We divide the heart wall to three layers – endocard, myocard and epicard.
We call cells of the myocard (the heart muscle) cardiomyocytes and divide them to two types – working and conducting. We divide cells of working myocard to atrial and ventricular working muscle cells. Their contraction is very similar to contraction of striated muscle cells, but differs in much longer duration. Specialised cells of conducting system contracts only weakly in the contrary, because they contains just low count of contractile fibres (myofibrils). According to this they manifest their activity by automatic periodical electric discharge in the form of action potential or by conducting of action potential through the heart and so they create excitatory and conductive system controlling the periodic beating of the heart. Thats because their membranes contains different ion channels and those cause mentioned specific electrophysiological qualities.
Individual cells of the heart muscle are interconnected by permeable connections called intercalated discs, we can find them at boundaries of single cells and they function as interconnecting complexes. So called gap junctions are component of intercalated discs, they able effortless passage of ions between cells. Thanks to those interconnections are cells of the heart muscle associating to the functional syncytium. When only one cell in this structure is excitated, action potential spreads to other cells. The heart is practically consisting of two syncitias – the atrial and the ventricular. Only one physiological interconnection between them is the bundle of His and isolation between them form fibrous cells of the cardiac skeleton. This separation of the heart muscle to two function syncytias allows the contraction of atrias and then contraction of ventricles with small delay, this is very important for the work effectivity of the heart as a pump.
_
Formation, conduction and spreading of cardiac excitation, action potentials
After the contraction of cardiac atria follows the contraction of ventricles and every part of heart relaxes during diastole, this all in normal conditions. The stimulus for contraction originates in the conductive system of the heart comprising sinoatrial (SA) node, atrial internodal pathways, atrioventricular (AV) node, bundle of His and its branching to left and right bundle branch of Tawar and following system of Purkinje fibres. The highest frequency of the excitatory stimulus is created by SA node and so we call it as primary heart pacemaker, this does not mean that other parts of conductive system are not able to create excitatory impulses. Even cells of working myocard are able to do it in pathologic conditions.
Basic electrophysiological attributes of heart muscle cells
Automacy (chronotropy) is the ability to generate impulses (with appropriate frequency). This leads to regular rhythmical contractions which emerge without any influence from outside.
Conductivity (dromotropy) means the conduction of the impulses to other parts of the whole heart leading to synchronic contraction of normal cardiomyocytes.
Irritability (bathmotropy) is the ability of the heart to respond only to signals of an appropriate intensity (intensity reaching or overshooting the threshold). Stimuli of lower intensity will not provoke the contraction.
Contractility (inotropy) is the power of muscle contraction.
Creating of an impulse in the heart
All myocardial cells are able to create the excitatory impulse – the heart automacy (autonomy). In physiological state is this impulse generated only by pacemaker cells which depolarize spontaneously during the diastole and trigger the action potential after the reaching of the threshold value. Other myocard can trigger it too, but only in nonphysiological conditions. Because myocard is functional syncytium, impulse arisen everywhere in ventricles or atrias will cause complete contraction of both ventricles and atrias – everything or nothing law.
Sinus node is called primary heart pacemaker, because the impulse for myocard irritation originates here physiologically. Irritation (depolarisation) spreads through atrial pathways from SA to AV node where is this electric current from atria physiologically slowed. This gives time for the filling of ventricles during the systole of atria. Then this impulse goes through the bundle of His to left and right bundle branch and then is conducted by the Purkinje fibres system to the whole myocardium of ventricles. There is this irritation spreading in direction from inner to outer layers and from the apex to basis of the heart, this process we can observe via ECG.
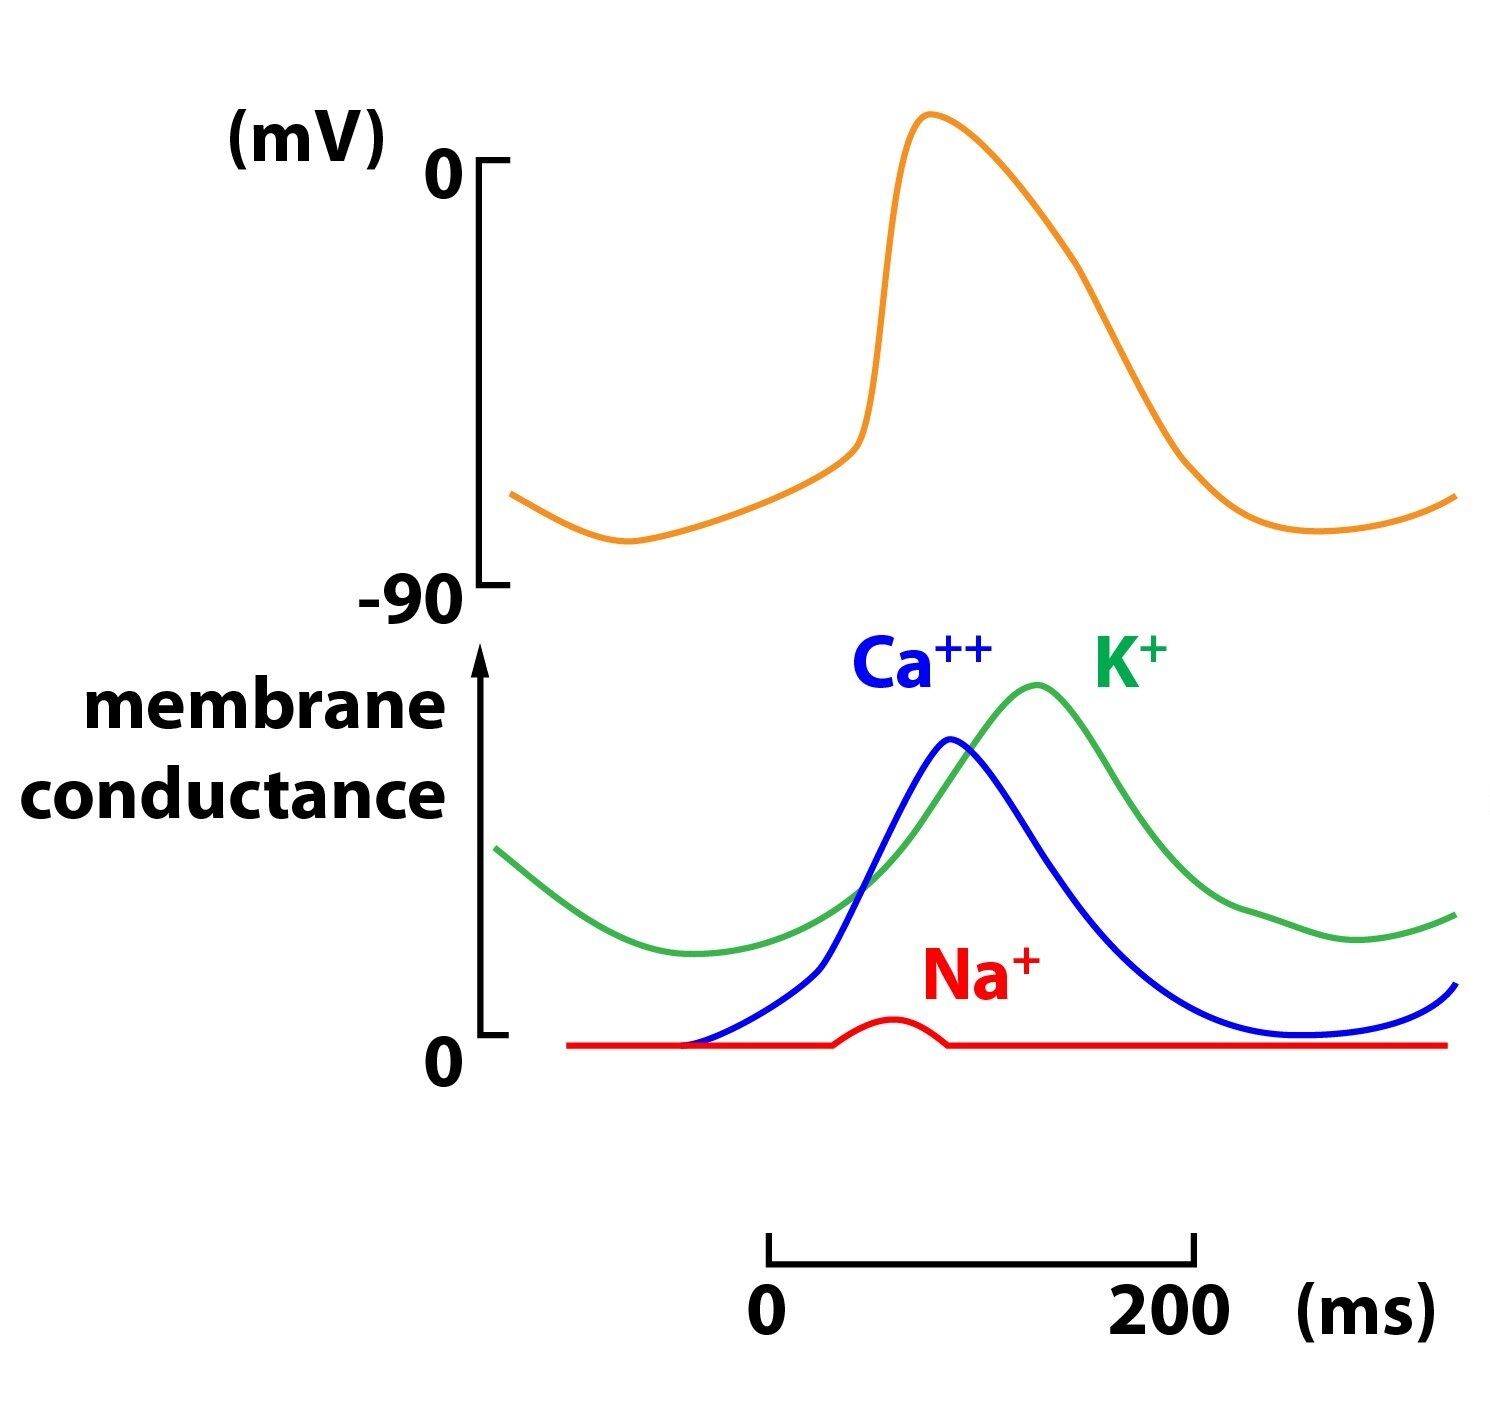
In the SA (and AV) node enter calcium (Ca2+) ions through slow channels to cells, thanks to this polarisation of their resting membrane potential (RMP, -65 mV) descends – so called prepotential. Pacemaker cells are spontaneously depolarising until they reach the threshold of -40 mV. In this moment are opening fast voltage gated calcium channels causing rapid phase of depolarization. During following repolarisation potassium channels opens and enable the leakage of K+ out of the cell. The value of membrane potential is becoming more negative and the process comes to its beginning. So the depolarisation of the SA and AV node is causing the influx of calcium ions into the cell and repolarisation is caused by the outflow of potassium positive charged ions from the cell. Influence of sodium cations is meaningless.
SA node produces during rest impulses of frequency of 60-100/min, other cells can produce impulses too. But frequency of other parts of conductive system is lower than of SA node. Other pacemaker cells can be the source of depolarisation in pathological conditions, but with lower frequency – secondary pacemaker = AV rhythm of about 50/min, terciar pacemaker = ventricular rhythm of about 30/min. These pathologic conditions are: hypoxia, ion disturbances (concentrations of potassium and calcium), excessive stimulation of adrenergic receptors, lower temperature or influence of medications.
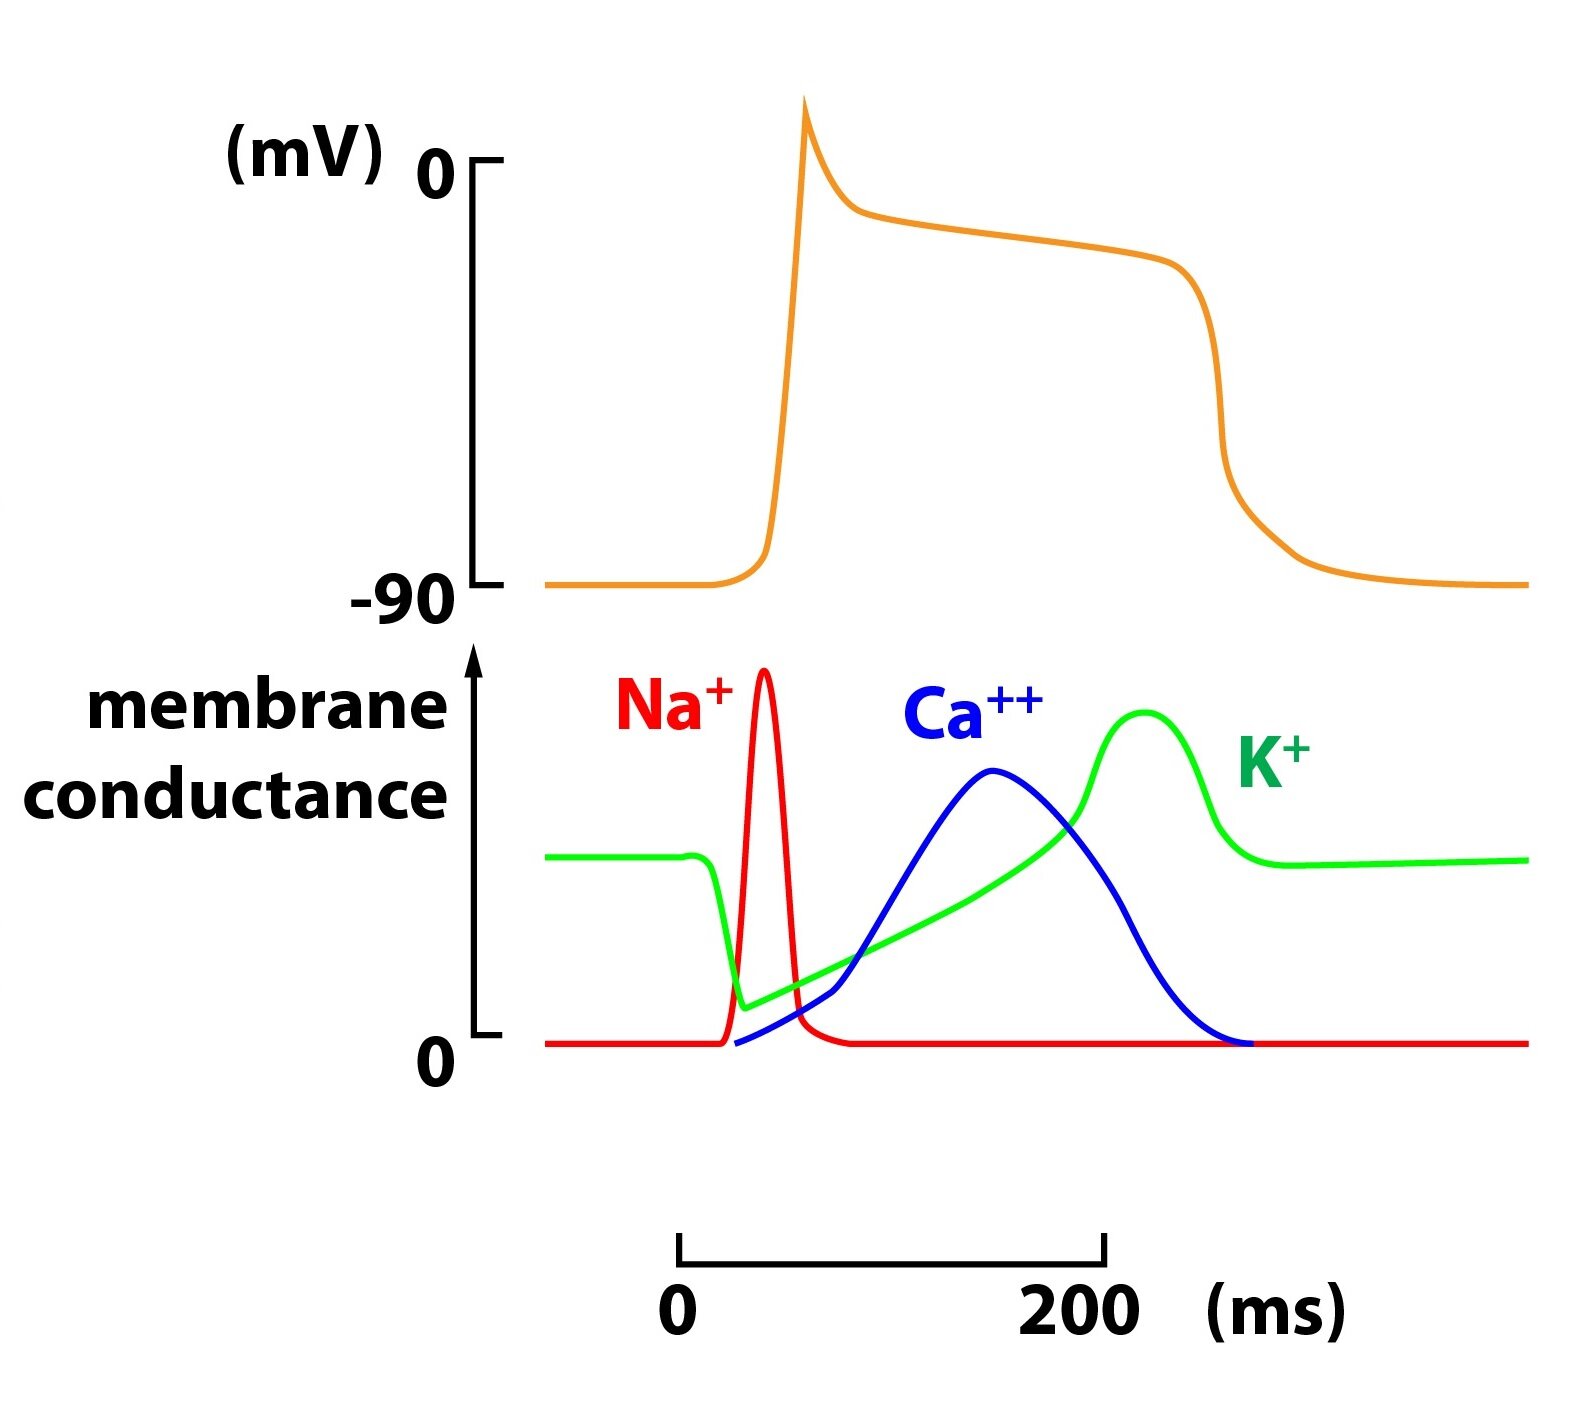
In cells of working myocardium during the action potential, after the depolarisation (phase 0 – opening of voltage gated Na+ channels) and the phase of fast repolarization (phase 1 – closing of Na+ channels) starts so called plateau phase. This plateau phase is caused by opening of voltage gated Ca2+ channels and subsequent slow current of incoming Ca2+ ions into cells. Next phase of repolarization to values of the resting membrane potential can follow only after the closing of calcium channels and is caused by leakage of potassium ions out of the cell. During the absolute refractory phase nor supra threshold stimulus can not elicit the action potential. This phenomenon protects the myocardium against the circling of the impulse – so called re-entry, we can divide it to micro re-entry which causes for example atrial flutter by circling in atrias and to macro re-entry leading to ventricular tachycardia by circulating within atria and ventricles around. During the so called relative refractory phase can be the action potential generated only by reaching by stimulus of value which is larger than resting membrane potentials threshold. In comparison with SA and AV node have cells of working myocardium fast voltage gated sodium channels which create rapid increase in the action potential during the depolarisation.
_
Electrocardiogram (ECG)
Depolarization of ventricles in humans starts in the left side of the septum and spreads to its central part to right. Afterwards depolarization turns to the apex and from there continues through walls of ventricles to their basis, going everywhere from epicardium to endocardium.
When electric current goes through the heart there are changes in voltage which can be recorded by the electrocardiography and its correctly attached electrodes even on the surface of the body. This acquired recording (so called electrocardiogram) informs us about the heart rhythm, action, frequency and about the position of the heart too. Changes in individual waves advise us notices about possible pathological processes. ECG does not give evidence about the function of the heart as a pump.
Leads
We use 12 leads in everyday praxis, we can compare them to 12 looks at the heart, every from different angle. If we imagine the heart placed into the center of equilateral triangle (Einthoven’s), we see in triangles vertices unipolar limb leads. Those we label R (right lead of a right upper limb), L (left – lead of a left upper limb) and F (foot – lead of lower left limb). We put the grounding zero electrode on a right lower limb. Thanks to its use we can amplify a recorded signal (intensify its voltage – Goldberger 1942) 50 % more. These augmented (amplified) leads we call aVL, aVR and aVF, where V means voltage which we measure in unipolar precordial leads V1-6 too.
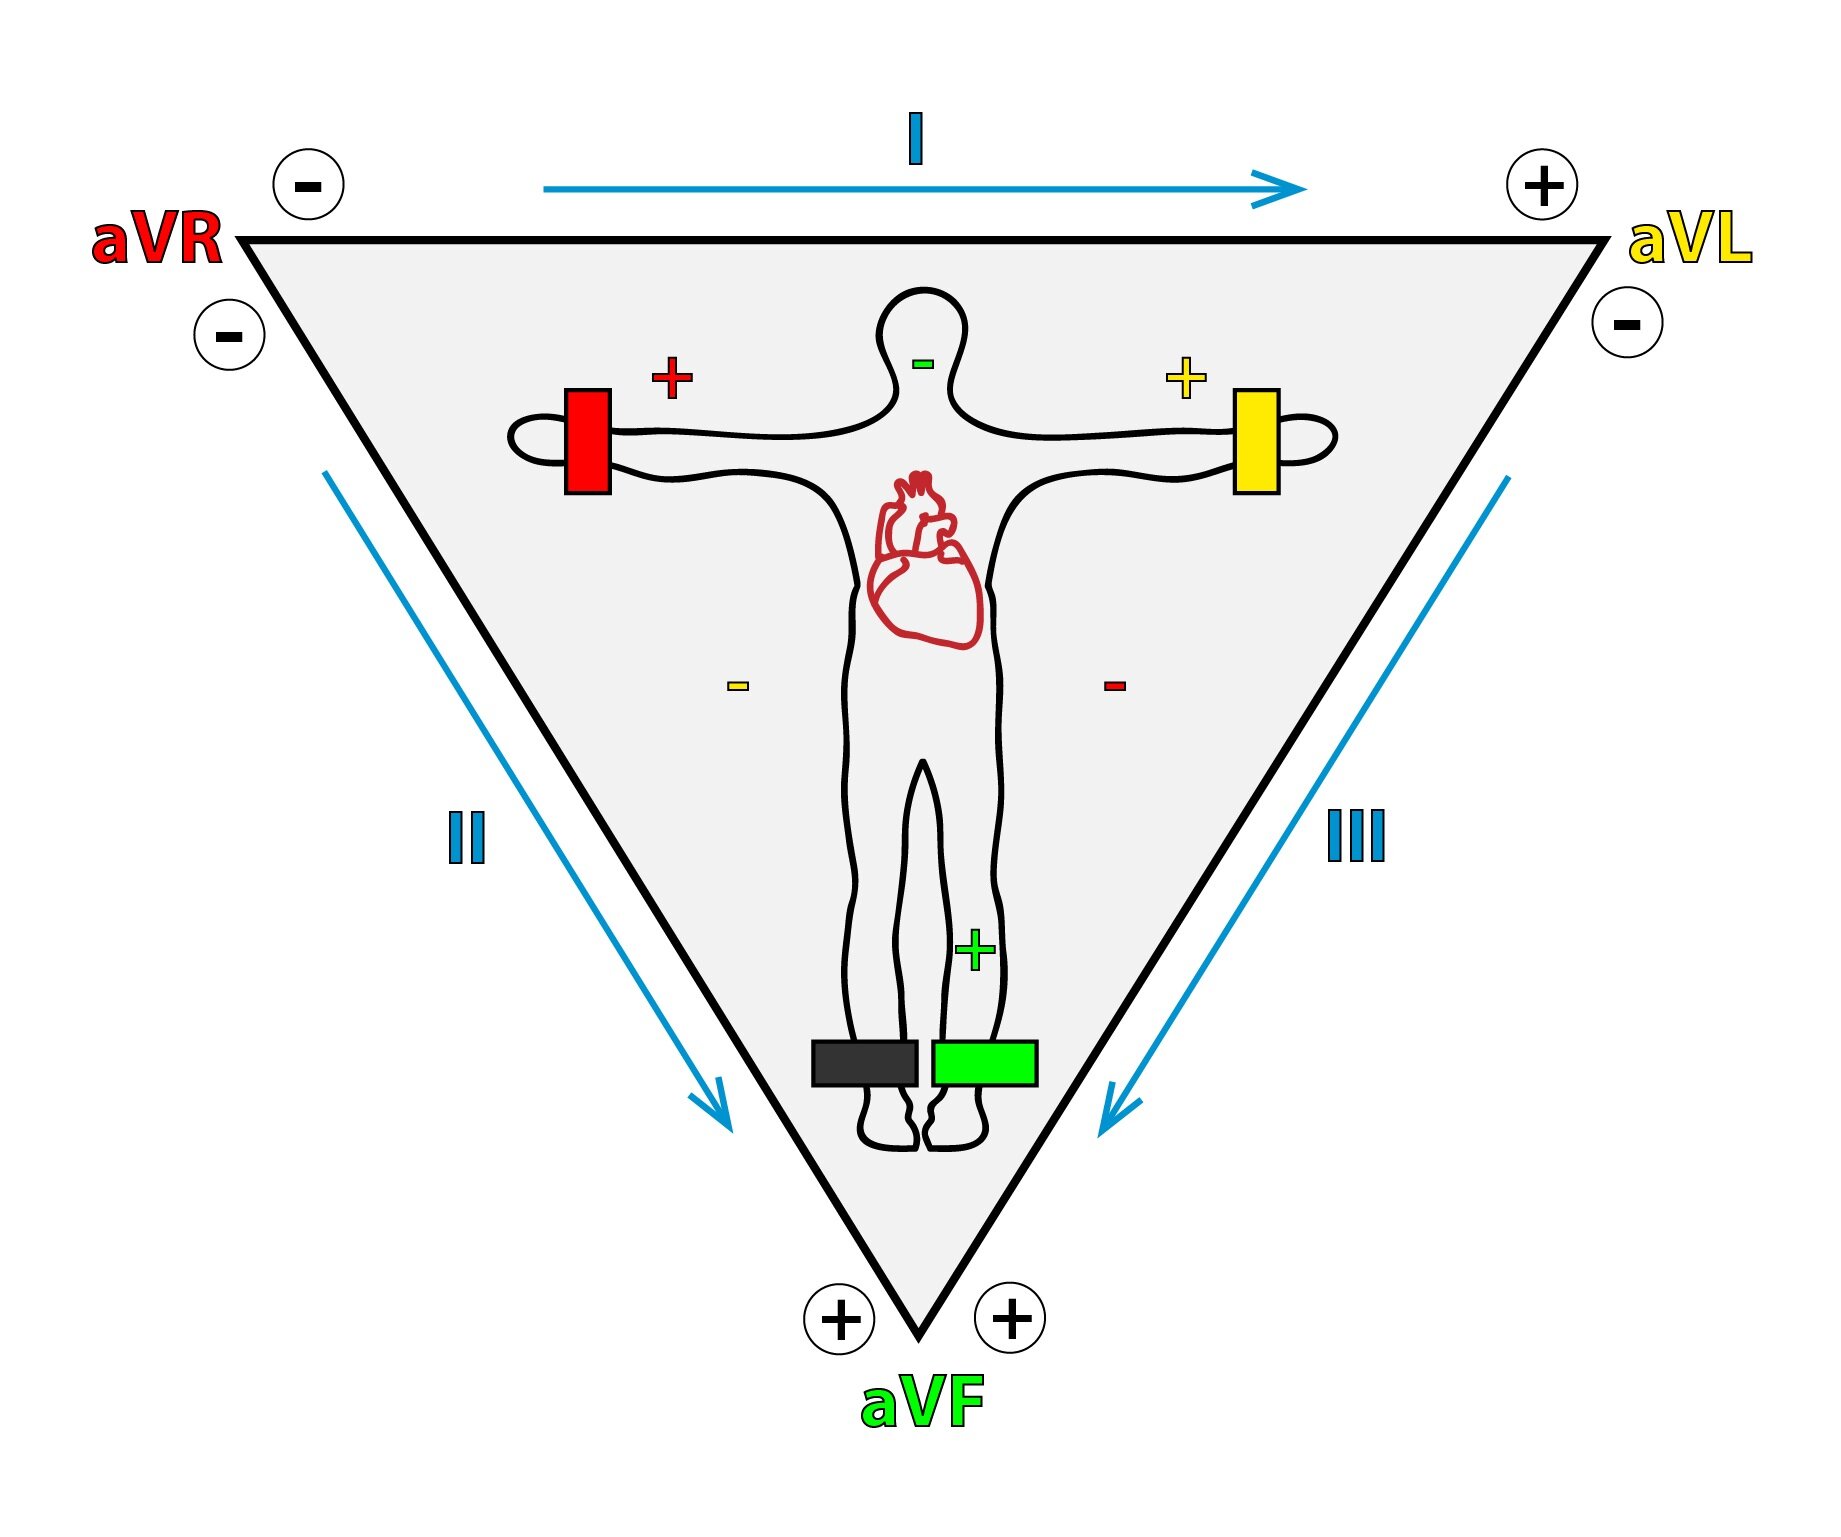
Standard bipolar limb leads we label as I, II and III. The term bipolar means that the detected recording is taken by two electrodes at different sides of the heart. The lead I joins the aVL and aVR of our equilateral triangle, the lead II joins aVR and aVF and the lead III we can imagine as the joint of the aVL and aVF.
The lead I is looking at the heart from left, in the other hand leads II and III are looking at the heart from down and in different angles so their recordings are similar in some way. Six leads mentioned before comprise six pictures of the heart electrical activity, in six different angles each 30° of degrees away. Those leads we can imagine arranged in one frontal level crossing the patients thorax.
Thoracic (precordial) leads provide another six looks at the electric activity of the heart. They are situated on the frontal and left surface of the thorax wall. Leads V1 and V2 are attached in the near of the right atrium, leads V3 and V4 in the near of the septum. Leads V4 and V5 are looking on the frontal part of the left ventricle, V4 nearby the apex. Leads V5 and V6 focus on the anterolateral wall of the left ventricle.
Normal ECG
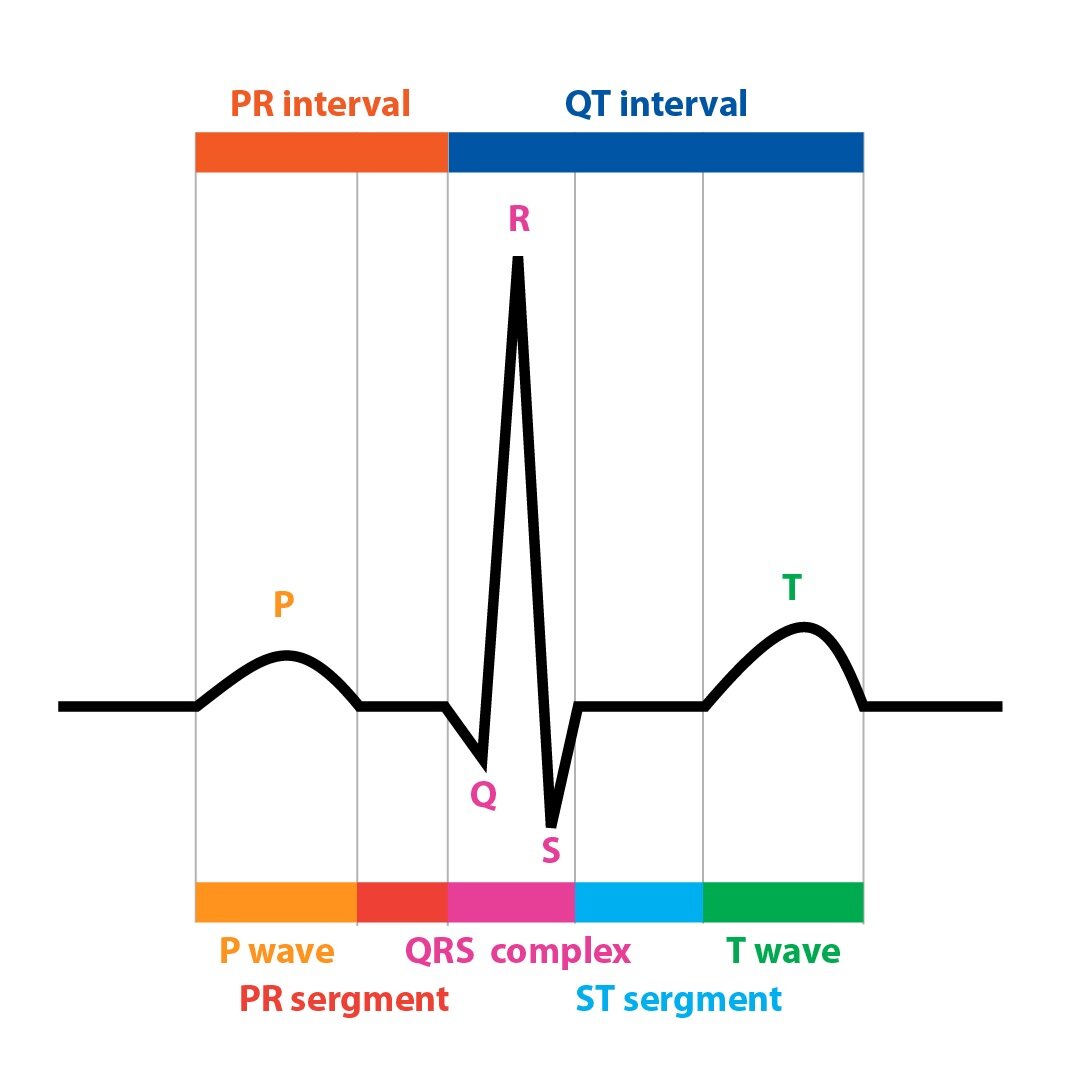 The P wave is record of the atrial electrical activity, the first part tapes the depolarisation of the right atrium, the second part the depolarisation of the left atrium. Physiological duration of this is up to 0,12 s. The PQ interval (from the start of the P wave to the start of the Q wave) informs about time needed by the electric impulse traveling from the sinoatrial node for the passing through the AV node, bundle of His, bundle branches of Tawar and Purkinje fibres till the beginning of the ventricular myocardium depolarisation, with normal duration of 0,12 – 0,2 s. The PQ segment (from the end of the P wave to the start of the Q wave) is the part during which are atrias activated completely, so we can see recorded line at the level of 0 mV. The wave of repolarisation of the atrias is not visible at the ECG recording, because the QRS complex overlaps it. Complex QRS is composed by Q, R, and S wave and it is the image of the electric activation (in the meaning of depolarisation) passing the whole myocardium of ventricles. Electric forces caused by depolarisation of ventricles are recorded as sharp edged spikes – waves. We label this part as the QRS complex even in the case when some of the waves is absent. Definition says, that the first positive wave is labeled as R. Normal length of the complex is up to 0,1 s. The QT interval (from the start of the Q wave to the end of the T wave) shows the whole duration of the depolarisation and the repolarisation of ventricles and its normal duration is up to 0,4 s. The ST segment (from the end of the S wave to the start of the T wave) is the time in which are both ventricles activated completely and is in the level of 0 mV too. The wave T is a reflection of the repolarisation of ventricles.
Basic procedures of ECG recording description
When we describe the ECG recording we first determine basic parameters which we can decipher. These are the rhythm, action, frequency and the axis of the heart (RAFO). Then there continue description of single waves, segments and intervals.
Rhythm
When the SA node is the pacemaker (so called sinus rhythm), so during the physiologic rhythm, the distance between every R wave is always the same and there is positive P wave, especially in leads I, II aVF and V2-V6. In leads III, V1 and aVL we can see P wave positive, negative or bipolar. In aVR it is negative. Distances between PP and RR are the same. The basic characteristic of the sinus rhythm are presence of the P wave and regularity of the action.
Action
The action of the heart can be regular or irregular. When the distances between R waves are always the same it is regular action and the other way around.
Frequency
If the speed of the paper movement is normal 25 mm/s, one big square (or 5 small squares) signify 0,2 s. We can determine the frequency with help of this table:
|
The number of large squares in one RR interval |
Heart rate |
|
1 |
300/min |
|
1,5 |
200/min |
|
2 |
150/min |
|
4 |
75/min |
|
6 |
60/min |
|
10 |
30/min |
Electric axis of the heart
The most frequent overall vector of the QRS complex has 60° in healthy persons – so called intermediate type of position. The vectors direction can shift to both horizontal (0°) or vertical (90°) position. We consider the range between -30° to +120° as normal. Deviation to the right is when the vector exceeds +120° and deviation to the left when exceeds the border of -30°. Deviation of the heart axis is used and very helpful in ECG diagnostic. When is the amplitude of the QRS complex positive in leads I and aVF the axis of the heart is normal, as we usually see in everyday clinical praxis. We can easily determine the axis of the heart with help of this table:
|
AXIS |
Complex QRS in lead I |
Complex QRS in lead aVF |
|
Normal |
QRS positive |
QRS positive |
|
Left |
ORS positive |
QRS negative |
|
Right |
QRS negative |
QRS negative |
See more detailed literature for more informations.
_
Cardiac cycle, cardiac output, Frank-Starling mechanism
The cardiac cycle is complex of processes from the start of cardiac muscle contraction to the next. Every cycle starts by spontaneous generation of the action potential in sinoatrial node and spreading of the depolarization across atrias to the AV node. Here is spreading slow and causes delay of 0,1 s before going to ventricles. The autonomous nervous system is influencing this delay – prolongs by the irritation of the nervus vagus and shortens by irritation of the heart part of the sympathetic innervation.
As mentioned above, nodal (means AV node) delay ables contraction of atrias before the contraction of ventricles, so atrias are working as basic pump for fulfil of ventricles and contraction of ventricles alone works as basic force for pushing the blood to the whole vascular system.
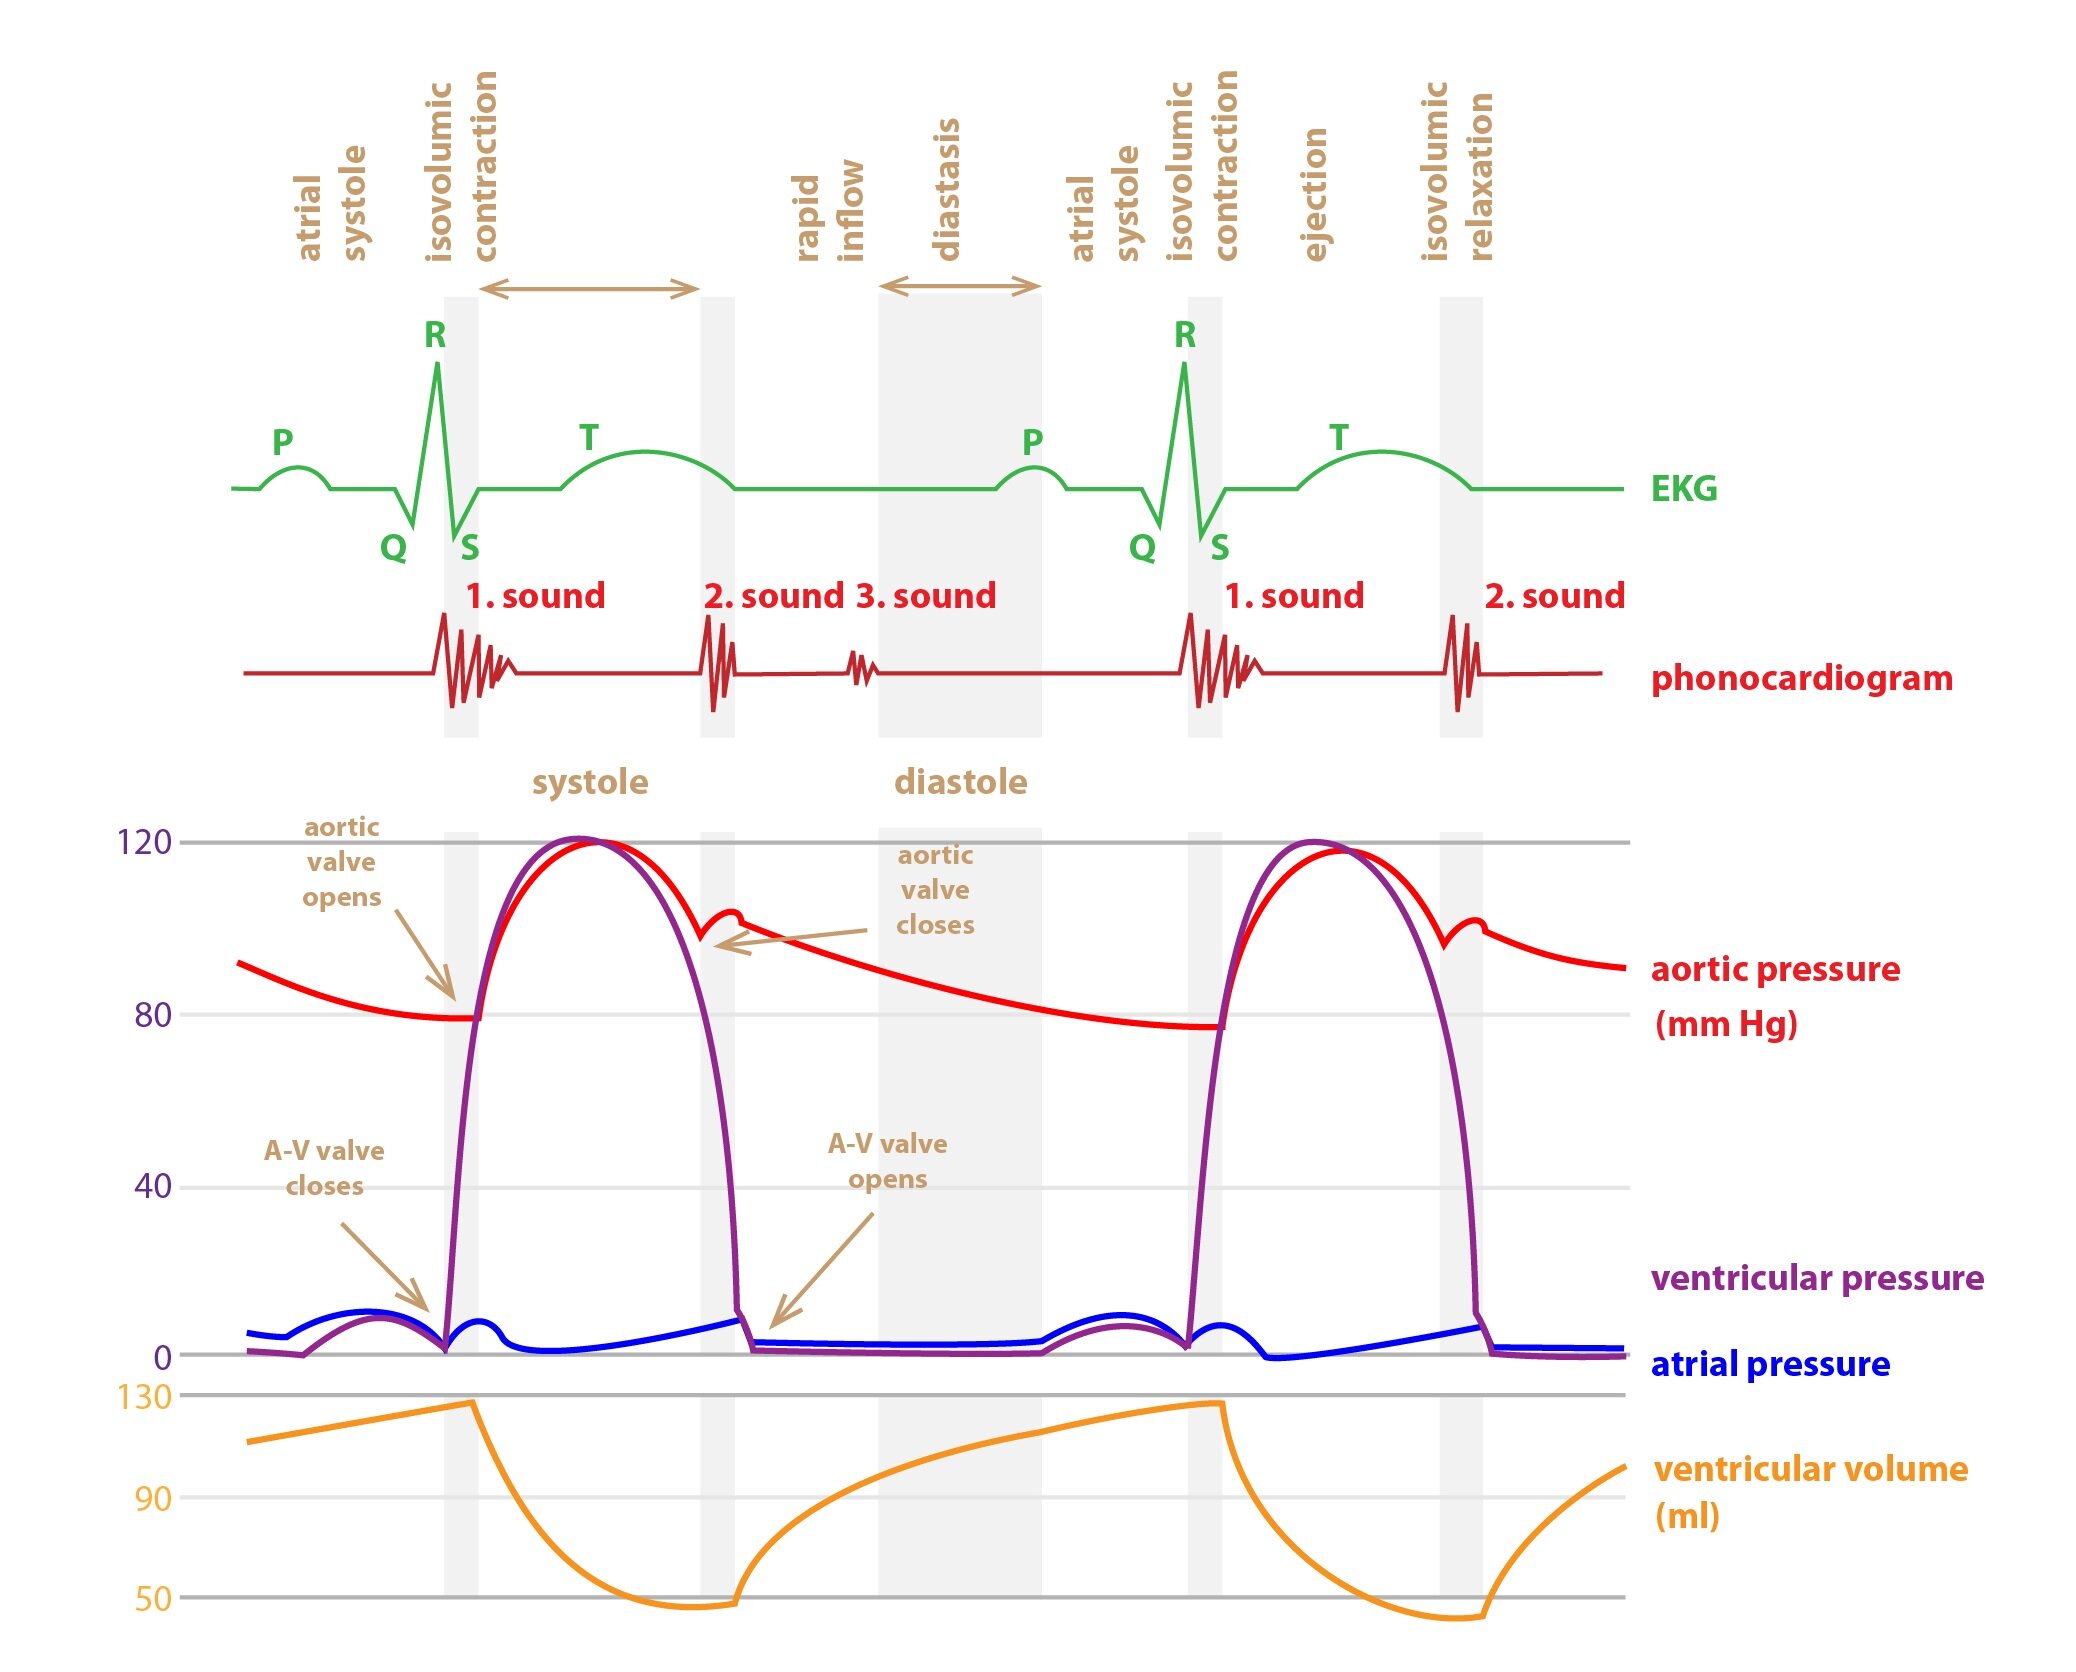
The cardiac cycle is composed by a relaxation phase called the diastole and a contraction phase called the systole. After the end of the ventricular systole aortic and pulmonary valves close and the diastole begins. In its first part the by pressure accumulated blood flows to ventricles, but without any action of the atrial myocardium. Comes so called rapid filling of ventricles part during which about 80 % of final volume of ventricles flows to them already without the contraction of atrias. In the second third of the diastole just a little of blood enters the ventricles, in left part this amount comes from big venes. In the last third of the diastole comes the atrial contraction causing the filling of ventricles by remaining 20 % of volume.
Isovolumic (isometric) contraction phase
At the start of ventricular systole are the mitral and the tricuspid valves closing by the influence of quick and strong pressure increasing, shortening of muscle fibres is so small, that is irrelevant. During the next 0.02 – 0.03 s is pressure still rising and in the next part enables the opening of semilunar valves.
Ejection phase
After the surmounting of the aortic pressure (80 mmHg) and pulmonary artery (8-10 mm Hg) are semilunar valves opened. In the first third of this phase is about 70 % of ventricular volume pulled out (rapid ejection phase), other two thirds are characterised by emptying of the last 30 % of volume (slow ejection phase).
Isovolumic (isometric) relaxation phase
The pressure of ventricles is descending thanks to the relaxation of ventricles at the end of the systole. In big arteries is still high pressure greater than in ventricles so semilunar valves are closing; ventricles are relaxing; but theirs volume does not change. During this period intraventricular pressure falls and A-V valves opens.
Within one cardiac cycle is changing the volume of a ventricle in the range of 110 – 120 ml during the diastole, this volume is called as end-diastolic pressure. During the systole is pulled out the systolic volume of value in the range of 70 – 80 ml. At the end of systole is in ventricle still volume of about 40 – 50 ml of blood, this volume is called end-systolic. A relative volume of every whole contraction of the heart pushed out blood, ejection fraction, is so about 65 – 70 %. The amount of blood pumped in one minute (so called minute volume alias cardiac output) is about 5 l in the rest. We can calculate it as multiple of the heart frequency and heartbeat volume. If we divide the result by the surface of body in square metres we will have cardiac index, which is about 3.2 l in average. Cardiac mnut output is distributed to individual organs in amount appropriate to their present importance for the organism and according to their actual needs – see more Subchapter 10/2.
Cardiac output is under the influence by many circumstances. Increase is caused for example by physical activity, excitement or anxiety and by pregnancy, high temperature or adrenaline. Decrease can cause for example transition from the lying to standing, tachyarrhythmia or various heart diseases.
Frank-Starling mechanism
This mechanism describes dependence of the cardiac contraction power to the initial length of muscle fibres. in the case of the heart as hollow organ is better to think about its volume than the length (factually end-diastolic volume). It is true, that as more is higher the end-diastolic volume (and so is the elongation of muscle fibres), so is the subsequent contraction more powerful. This mechanism is limited and after the reaching behind some borders the power is descending in the other hand (for example in dilated heart).
Preload
We can understand the preload as a parameter impacting to the heart muscle before the initiation of the contraction. We can imagine it as beginning stretch of muscle fibres or ventricular volume (end-diastolic volume concretely). If rises fulfill of the heart the end-diastolic volume increases and systolic volume too.
Afterload
We can comprehend afterload as a parameter against to which is the heart muscle working. We can imagine it as the resistance to the flow of the blood or aortic pressure, because aortic valve opens only after the ventricular pressure exceeds that in aorta. Increase in afterload rises demands on the myocardium in which then ascends consumption of both nutrients and oxygen.
_
Function of cardiac valves
Opening and closing of cardiac valves is passive. Atrioventricular (A-V) valves (tricuspid and mitral) prevent retrograde flowing of the blood from ventricles to atrias during the systole. Contraction of papillary muscles of those valves is in the motion in the same moment as the contraction of ventricles and so avert disproportionate pushing out to atrias during the systole. The rupture of papillary muscle can lead to insufficiency of the valve and so to regurgitation to the atrium during the systole. There can be serious heart failure as a result. Semilunar valves (pulmonary and aortic) prevent retrograde flow from aorta and pulmonary artery back to the ventricle during the diastole.
The most available method for measuring of ejection fraction and cardiac valves function is the echocardiography with usage of doppler technology.
_
Control of cardiac activity
The parasympathetic innervation of the nervus vagus with mediator acetylcholine has negative chronotropic effect on the SA. It causes slowing of the impulse transition – negative dromotropic influence.
The sympathetic innervation (noradrenaline) and adrenaline from circulating plasma has positive chronotropic influence, so increases heartbeat frequency in sinoatrial node. It accelerate transition of the impulse to ventricles – positive dromotropic influence. Both noradrenaline and adrenaline have direct effect on the intensity of contraction of the working myocardium – positive inotropic.
_
Energy metabolism of the heart
The heart has to carry out about 100 000 contraction per day (during the heartbeat frequency of 70/min). This activity consumes about 15 % of daily energetic body output. About 6 kg of ATP is synthesized (recycled) daily, that means 20 – 30 times more than the heart weights. So it is not surprise that cardiomyocytes are rich in the number of mitochondria and have high concentration of the myoglobin. Our heart requires only aerobic metabolism, it can not work in oxygen debt for a long time. During the systole are intramural coronary arteries pressed by the contracting myocardium. So supply of oxygen and nutrients is transported effectively to the heart only during the diastole. Extraction of the oxygen in the coronary bed is one of the highest in the body.
Myocardial cells gain the ATP mostly by oxidative phosphorylation. Energetic substrates are:
1) 60-90 % fatty acids and ketone bodies
2) 10-40 % pyruvate: 50 % from the glucose (enters by insulin-dependent GLUT 4), 50 % from the lactate (very effective consumption)
There are some reserves of glycogen, but they are of just 20 % in compare with the striated skeletal muscle.
_
Heart as an endocrine organ
In the human heart are synthesized some substances with influence in the homeostasis of our body. We can state natriuretic peptides as an example.
Now we know about several natriuretic peptides bud major are two – ANP (atrial natriuretic peptide) and BNP (brain natriuretic peptide). Both have important vasodilatory effect, rises natriuresis (they inhibit backward resorption of Na+ – higher loss of Na+ by urine) and diuresis and reduce the sympathetic activity.
The ANP is produced by myocardial cells of cardiac atrias (for example during higher venous return – causes dilatation of atrias). BNP was described first time in brain of a pig (and so named). It is produced predominantly by myocardial cells of heart ventricles – signal is increased tension in the ventricular wall or their dilatation. So natriuretic peptides arrange reaction of organism to excess of Na+ and higher volume of the blood – surplus of their excretion is typical for the overloading the heart.
Clinical correlation:
In clinical praxis are levels of natriuretic peptides measured, especially N-terminal fragment of proBNP (NT-proBNP), to exclude the heart failure in acute dyspnoic person and for the determination of prognosis of the patient affected by the heart failure.
Subchapter Authors: Peter Ivák, Josef Kroupa, Patrik Maďa and Josef Fontana
![]()