Content:
1. Basic information about the blood plasma and its application in laboratory testing
2. Water content and osmolarity
3. Low molecular weight compounds
4. High molecular weight compounds
_
Basic information about the blood plasma and its application in laboratory testing
Blood plasma, making up the liquid portion of blood, is a colloid solution of organic and inorganic substances (electrolytes, nutrients, proteins, hormones etc.) with an addition of dissolved blood gases. It is slightly opalescent and its pale yellowish colour is caused by the presence of pigments, formed by decay of erythrocytes.
The volume of blood plasma is approximately 2.8-3.5 l (or 40-45 ml / kg of weight). Together with the lymph, it makes up 25 % of extracellular fluid (ECF).
For an overview, lets look at some basic information about the distribution of the total body water. To learn more, see Subchapter 7/6.
Total body water (TBW) makes up 55-60 % of the human body weight. The percentage of water content in the body of adult female is, due to higher amount of adipose tissue (which has relatively low water content), lower. The decrease also occurs in older age. Children and pregnant women, on the other hand, have higher TBW% (total body water percentage). Approximately 2/3 of TBW is the intracellular fluid (ICF) and the rest (1/3) is the extracellular fluid (ECF), which can be further divided into:
1) Intravascular fluid (IVF) – found in blood vessels (blood plasma and lymph) makes up ¼ ECF
2) Interstitial fluid (ISF; or tissue fluid) – makes up ¾ ECF
Laboratory testing
In order to obtain the blood plasma, it is very important to add an anticoagulation agent to the sample of “full” blood collected from the patient. Otherwise, blood would quickly coagulate, due to the presence of the coagulation factors in plasma. The next step is a centrifugation, which separates plasma from the blood elements. It is important to remember, that the anticoagulation agents often contain various ions and thus interfere with the measurement of their concentration in blood plasma. However, because there is no coagulation, the coagulation factors are spared and so it is possible to perform the coagulations tests. Tests done on blood plasma are often used in emergency medicine.
Without the addition of anticoagulation agents to full blood, a clotting occurs and the fluid left after a clot is formed is called blood serum. It can be used to perform most of the common laboratory blood tests. Its composition is similar to blood plasma, apart from containing the blood degradation products of coagulation and being free of the coagulations factors.
We use the -emia ending to indicate that a concentration of particular substance has been measured in plasma – e.g. glycemia, calcaemia or natremia.
Composition of blood plasma
Blood plasma is composed of:
1) Water
2) Low molecular weight substances
a) Ions (minerals)
b) Energy substrates
c) Metabolites
3) High molecular weight substances
a) Proteins
b) Lipoproteins
_
Water content and osmolarity
Water is the main constituent of blood plasma; it makes up 90-92 % of its volume. Apart from free water, plasma contains hydration water as well, bound for example to proteins.
The osmolarity of blood plasma is the number of the osmotically active particles in one liter and it is measured in osmoles per liter ([osm/l]). It mostly depends on the concentration of low molecular substances (ions, nutrients and metabolites). Healthy individual has the value of osmolarity between 280-295 mosm/l (urine has the osmolarity between 50-1200 mosm/l).
The clinical relevance of these values lies in the fact, that due to a good permeability of cellular membrane for water, the osmolarity of ECF correlates quite well with the osmolarity of ICF. Thus the osmolarity of ECF informs us about the acido-basic state of cells (albeit with some delay). Changes in osmolarity lead to the transfer of water, electrolytes and some other substances between intravascular, interstitial and intracellular environments. It is good to remember, that some substances pass to the ICF freely, some do not cross the cell membrane or the vessel wall.
A rapid change in osmolarity leads to rapid shift of water molecules inducing a change in the volume of cell, a process that threatens especially brain cells. A drop in osmolarity of ECF causes water to enter the cells (that are now hypertonic compared to ECF), their volume increases and leads to an edema (e.g. brain edema). On the other hand, a quick rise in osmolarity causes cell to decrease in volume and shrink (typically leading to demyelination in pons of the brain).
The osmolarity is very strictly regulated variable. Its changes are detected by the osmoreceptors in hypothalamus that subsequently modulates the secretion of antidiuretic hormone (ADH), a key hormone involved in regulation of osmolarity. ADH increases the reabsorption of water in the distal tubules and collecting ducts of kidneys. A change in osmolarity as small as 1 % leads to about 100 % change in ADH plasma concentration. To learn more see Subchapter 11/3 and Subchapter 7/6.
When administering the infusion solution it is important to respect the tonicity of blood plasma. Therefore, in clinical use we mostly administer isotonic solutions with osmolarity similar to plasma. Hypertonic solutions (with osmolarity lower than plasmatic) can lead to hemolysis and hypertonic (of higher osmolarity compared to plasma) can irritate blood vessel’s wall. Examples of isotonic solution include: saline solution (0.9% NaCl – 154 mmol/l Na+ a Cl–), 5% glucose (after metabolising, however, only free water is left – hypotonic solution), Ringer’s or Hartmann’s solution (with ion composition similar to plasma) and others.
The value of osmolarity can be found out not only by its measurement (by osmometer), it can also be calculated. Value obtained by calculation is called calculated osmolarity – we only substitute the plasma concentrations of following substances:
Osmo (Calc) = 2 [Na+]+ 2 [K+] + [urea] + [glucose]
The equation above can be simplified as:
Osmo (Calc) = 2 [Na+] + [urea] + [glucose]
In some situations it is advantageous to determine so-called osmotic (also termed osmolar or osmolarity) gap (OG). It is a difference between a directly measured osmolarity and a calculated osmolarity (e.g. according to the equation (2)). Physiologically, the osmotic gap is between 4-12 mosm/l. Osmometer measures solutes, which are not included in equations. If blood plasma contains quantitatively large amounts of these osmotically active substances, the difference between the directly measured and calculated osmolarity rises above the physiological range. The OG is useful in diagnostics of some types of poisoning (e.g. methanol, ethanol, ethylene glycol etc.) or imbalance of the intermediary metabolism (e.g. diabetic ketoacidosis accompanying type 1 DM). 1 ‰ increase in blood level of ethanol leads to 23 mmol/l rise in osmolarity.
_
Low molecular weight compounds
Ions
To maintain the electrical neutrality of blood, it is necessary for the concentrations of positively and negatively charged particles to be equal (the law of electroneutrality). The most abundant cations (contributing to the positive charge) in plasma are Na+, K+, Ca2+ a Mg2+. The most numerous anions include Cl– a HCO3–, other (like HPO42- and HSO4– are more scarce). The difference between the concentration of commonly measured cations and anions is called the anion gap (AG):
AG = ([Na+] + [K+]) – ([Cl–] + [HCO3–])
Due to the relatively low values we can omit the concentration of K+ from the calculation. Physiologically, the concentrations of the above mentioned cations exceed the concentrations of anions and thus the value of AG is positive – ranging from 14 ± 2 mmol/l. AG includes the anions that are not commonly measured – phosphates, sulphates, plasma proteins and anions of organic acids (lactate, ketone bodies, …). These substances compensate the positive charge of plasma cations. AG changes in similar situations as the OG – e.g. in cases of poisoning (methanol, ethylene glycol, …), ketoacidosis or lactic acidosis.
Sodium cation (Na+) – 135-145 mmol/l
Sodium cation is the main cation of extracellular fluid. Together with Cl– it is responsible for 80 % of plasma osmolarity and by binding water molecules it determines the plasmatic volume. The level of sodium cation is regulated by mutual action of several hormones: aldosterone and natriuretic peptides (e.g. ANP – atrial natriuretic polypeptide).
Chloride anion (Cl–) – 97-108 mmol/l
Chloride anion is the main anion of extracellular fluid. Due to the existence of electrostatic interactions it accompanies the sodium cation and contributes to the maintaining of plasma osmolarity and volume.
Potassium cation (K+) – 3.8-5.2 mmol/l
The plasmatic concentration of potassium cation (3.8-5.2 mmol/l) is significantly lower in comparison with its intracellular concentration (around 155 mmol/l). Thus the amount of extracellular potassium makes up only 2 % of its total amount in the body. A membrane gradient created by K+ significantly influences the value of membrane potential. Physiological distribution of cations (with Na+ located mainly in ECT and K+ in ICT), maintained at relatively high energy costs via Na+/K+-ATPázy, is essential to sustain proper cell function (neuromuscular excitability, heart activity, …)
Calcium cation (Ca2+) – 2.25-2.75 mmol/l (ionised fraction 1.1-1.4 mmol/l)
Extracellular concentration of calcium (2.25-2.75 mmol/) is four orders of magnitude higher than its intracellular concentration. Ca2+ in blood plasma occurs in two main fractions – bond and free:
1) 46 % of Ca2+ is bound to the plasmatic proteins (albumin mostly)
2) 6 % of Ca2+ is bound in complexes with small anions (HCO3–, citrate, lactate)
3) 48 % of Ca2+ forms a free, ionized fraction, which alone is physiologically active
The ratio of fractions (under stable calcemia) depends on the concentration of proteins (protein losses cause a drop in bound fraction) and pH (H+ ions compete with Ca2+ for a binding places on albumin, causing a decrease in ionised Ca2+ when pH increases and an opposite effect when pH decreases; it is also a reason why hyperventilation can lead to tetany).
Another significance of calcium ion lies in its ability to stabilise membranes of excitable tissues (when Ca2+ drops, spasms are more likely to occur), allow the muscle contraction and coagulation – blood clotting. Ca2+ activates the coagulation factors (those, whose synthesis depends on vitamin K – f. II, VII, IX, X, protein C and S). Calcium is also necessary for lactation and it is a part of inorganic bone matrix (hydroxyapatite). There exist a dynamic equilibrium between a plasmatic concentration and the fraction of calcium in bone tissue.
Bicarbonate anion (HCO3–) – 24 ± 2 mmol/l
Bicarbonate forms the most important blood buffer system – it accounts for up to half of its buffering capacity. At the same time, it is involved in transport of CO2 from tissues to the lungs.
Phosphates – 0.7-1.5 mmol/l
_
Energy substrates
Glucose – 3.3-5.6 mmol/l
Blood glucose is transported freely dissolved in plasma. Its plasmatic concentration (glycemia) is strictly regulated by hormonal (insulin, glucagon, epinephrine, cortisol, …) and autonomous nerve system.
Free fatty acids – 0.6-1.7 mmol/l
Fatty acids with chains shorter than 12 carbon atoms are transported dissolved in plasma and those with longer chains bound to albumin (the longer the chain, the more predominantly are the fatty acids transported bound to albumin). Other lipids use high-molecular particles called lipoprotein (see below).
Ketone bodies
Ketone bodies are, similarly to glucose, freely soluble in water and as such are transported in plasma. The concentration of 3-hydroxy butyrate is (when fasting) < 0.5 mmol/l and increases during starvation. Ketoacidosis is a state of metabolic acidosis, when the concentration of ketone bodies exceeds 3 mmol/l and leads to a significant drop in pH of blood.
Amino acids – 2.3-4.0 mmol/l
Plasmatic levels of individual amino acids vary, their total concentration is between 2.3 and 4.0 mmol/l. The most abundant is glutamine (0.6 mmol/l), the main transport form of ammonia, and alanine (0.3 mmol/l)
Nitrogen metabolites
Ammonia – 6-35 µmol/l
Most of the ammonia comes from the deamination of amino acids. Ammonia is highly toxic substance and thus is transported in blood mostly in the form of glutamine and less as alanine.
Urea – 2.5-8.3 mmol/l
Urea represents the end product of protein (or amino acid) degradation. It is formed in liver.
Creatinine – 50-120 µmol/l
Creatine forms from its precursor molecule creatine phosphate (serving as an energy source in the process of ATP regeneration) in muscles through irreversible non-enzymatic dehydration and phosphate elimination. Plasmatic creatinine levels depend significantly on the physical constitution of the individual (especially the amount of muscle tissue) and diet.
Uric acid – 150-360 µmol/l
Uric acid is the degradation end product of purine metabolism. The plasmatic concentration varies between sexes.
Bilirubine – up to 17 µmol/l
The total bilirubin concentration is the sum of unconjugated and conjugated bilirubin. Concentrations above 40 µmol/l lead to the development of jaundice (icterus).
_
High molecular weight compounds
Lipoproteins
Lipoproteins (LPP) are spherical particles made of:
1) Amphiphilic coating made of phospholipids, cholesterol and proteins (called apoproteins)
2) Hydrophobic core containing TAG and cholesterol esters
Phospholipids non-covalently (through electrostatic and hydrophobic interactions) bind apoproteins (labeled as Apo and corresponding letter / number) that differ among the lipoprotein classes. Apoprotein thus characterizes a particular class of lipoproteins and similarly helps our body to recognise and process the individual lipoproteins – apoproteins work as ligands to receptors in target tissues and as activators of enzymes involved in lipoprotein metabolism. To sum up the function of apoproteins:
1) Structural Apo: Apo B100 and Apo B48
2) Cofactors (activators) of enzymes: Apo C-II (lipoprotein lipase enzyme) and Apo A-I (LCAT enzyme)
3) Receptor ligands: Apo B100 and Apo E (for LDL-receptor), Apo E (for remnant receptor), Apo A-I (for HDL-receptor)
We classify lipoproteins according to their density and apoprotein content into five classes. Higher content of TAG inside LPP core corresponds with lower density and vice versa, higher content of proteins increases the density. All classes of LPP mutually exchange their apoproteins, TAG and cholesterol esters (CE) during their circulation in blood. According to the increasing densities, we recognise the following classes:
1) Chylomicrons
2) VLDL (very low-density lipoprotein)
3) IDL (intermediate-density lipoprotein)
4) LDL (low-density lipoprotein)
5) HDL (high-density lipoprotein)
1) Chylomicrons
Chylomicrons are synthesized in enterocytes (absorptive cells of the small intestine) from TAG and cholesterol esters. Their main function is to transport dietary lipids from intestines to other body tissues. Due to the high TAG content they have the lowest density among all LPP. Their main apolipoprotein is Apo B48, however they contain other apoproteins as well (Apo C-II and Apo E), obtained in the process of exchange mostly from HDL particles.
Chylomicrons synthesized in intestines are firstly transferred into the lymph and then, through ductus thoracicus, bypassing the liver, into v. cava superior and system circulation. Apo C-II acts as a ligand for lipoprotein lipase (LPL; activated by insulin) (located mainly at endothelium of adipose tissue and striated muscles) that hydrolyses TAG to FA (absorbed into the tissue) and MAG (monoacylglycerols).
Through this process of degradation, chylomicrons gradually decrease in size (and contain larger proportion of CE and MAG) and form chylomicron remnants. Remnants are taken up from circulation and removed by the liver (Apo E acts as a receptor ligand).
2) VLDL (very low-density lipoprotein)
VLDLs are formed in liver from the newly synthesized TAG. Their density is only slightly higher than the density of chylomicrons. Apo B100 is their chief surface apoprotein. VLDL transport TAG from liver into the periphery, where they degrade through an action of LPL (similarly to chylomicrons, they are broken down into FA and MAG) and decrease in size to form so-called IDL (or VLDL remnants).
VLDL exchange their content with other LPL, mostly with HDL. With the help of CETP enzyme (cholesterol ester transport protein) CE are transferred from HDL to VLDL and TAG in the opposite direction.
3) IDL (intermediate density lipoprotein)
IDL are formed from VLDL through an action of LPL (which explains why their structural apoprotein – Apo B100 is identical to VLDL). They differ from VLDL mainly in higher CE content and lower TAG content. Eventually they end up in liver, where they are either absorbed and degraded in hepatocytes or transformed to LDL (with high CE content) by the elimination of TAG (HRHL – heparin-releasable hepatic lipase)
4) LDL (low-density lipoprotein)
LDL can be synthesized de novo or form IDL (with the help of HRHL). Apo B100 is their chief apoprotein and they contain CE mostly, which they transport to the peripheral tissues (this explains their proatherogenic potential – LDL are sometimes referred to as a “bad” cholesterol). When required, cells express LDL-receptor (receptor of Apo B100 and Apo E), through which, LDL particles are internalized into cells.
Plasmatic LDL concentrations should not exceed 3.0 mmol/l (or 2.5 mmol/l for diabetic patients).
5) HDL (high-density lipoprotein)
The main function of HDL is a reverse transport of cholesterol from the peripheral tissues back to the liver. Liver transforms the collected cholesterol into bile acids and eliminates it. HDL particles are synthesized mainly in liver and enterocytes in a form of flat empty discs, consisting only of a membrane containing Apo A1,2,3 and lower amounts of Apo C-II a Apo E. These empty discs are termed as nascent HDL.
With the help of LCAT enzyme (lecithin cholesterol acyltransferase; with Apo A-I as its cofactor), which does esterification of cholesterol as it enters HDL particle, the nascent HDL gradually fills up with CE and changes to so-called HDL3 and HDL2α particles. They differ in the amount of cholesterol (HDL3 contains less cholesterol than HDL2α).
HDL2α exchanges lipids with VLDL through CETP (cholesterol ester transport protein): VLDL give up TAG and HDL2α changes to HDL2β. It is transported to liver, where it experiences the same fate as IDL. HRHL hydrolyses its TAG, thus transforming HDL2β back into HDL3 and sends it back to the circulation. Portion of HDL degrades in liver and its cholesterol, transformed to bile acids, gets eliminated through feces.
HDL is sometimes labeled as a “good” cholesterol, because it protects against atherogenesis. The plasmatic concentration of HDL should be above 1.0 mmol/l in males and above 1.2 mmol/l in females (before the menopause, sex hormones protect females against atherosclerosis).
Several mutations affect different parts of metabolic pathway of LPP synthesis, transport and uptake. They can lead to an increased plasmatic concentrations of particular lipoproteins and thus significantly increase the risk of atherosclerosis. An example is a mutation of LDL-receptor gene, which causes impaired LDL uptake and increases the level of cholesterol in plasma. Cholesterol builds up in blood vessels’ walls and causes atherosclerosis and its complications (myocardial infarct, stroke, …) at a young age.
Plasma proteins – 60-80 g/l
Plasma proteins form a heterogeneous group comprising more than 300 types of proteins. Most of them belong to the group of glycoproteins, with an important exception of albumin that is not glycosylated. Thanks to the presence of both carboxy and amino groups, proteins behave as ampholytes. At physiological pH of blood (7.4) the negative charge prevails and proteins form anions.
The site of the synthesis of most plasma proteins is liver, apart from immunoglobulins, which are synthesized by plasma cells. Other cells of human body are also capable of synthesizing some of the proteins (e.g. β2-microglobulin).
The total concentration of proteins in serum (serum total protein) ranges around 60-80 g/l and is dependent on many factors: the rate of the synthesis and degradation, distribution in body fluids, losses to the third compartment, hydration, and elimination. Physiologically higher concentrations can be observed in the standing position and at increased muscle activity. On the other hand, lower concentrations are physiological for children, pregnant women or after prolonged fasting.
Plasma proteins have many functions:
1) Maintaining of a part of the osmotic pressure, so-called colloid-osmotic pressure of plasma protein, or oncotic pressure: its value is approximately 25 mmHg (or 2.2 kPa) and it exist because the blood vessel wall is normally impermeable to most of the proteins.
2) Playing an important part in the processes of coagulation and fibrinolysis
3) Being one of the buffer systems of the blood
4) Transporting substances poorly soluble in water
5) Being part of the immune system as antibodies, complement and APR (acute-phase reactants)
6) Having antioxidant functions
7) Having a diagnostic importance: enzymes, markers
One of the basic screening tests of plasmatic proteins, used to identify anomalies in their spectrum is electrophoresis. It is based on the fact that plasmatic proteins, because they are charged, move through a matrix in the electric field. We can use various kinds of matrices, for example agarose gel, which causes the proteins to separate into 5 or 6 fractions:
1) Albumin
2) Alpha-1 fraction
3) Alpha-2 fraction
4) Beta fraction (sometimes further divided into beta-1 a beta-2 fraction)
5) Gamma fraction
1) Albumin – 35-53 g/l
Albumin makes up 60% of all plasma proteins. It molecule is relatively small (with Mr = 68 000, which is a threshold value of the permeability of glomerular filtration membrane). That is why, when the membrane is damaged, albumin is one of the first plasma protein that shows up in the urine. Albumin synthesis in liver is approximately 12 g/day, which represent about 25% of the total synthetic capacity of liver for albumin. Half-life is quite long, around 20 days, which means that a drop in the production (e.g. due to malnutrition or starvation) becomes visible only after a longer time.
Albumin’s main function is the maintenance of the oncotic pressure (it is responsible for 80% of its value). Hypoalbuminemia leads to the fluid leakage from the intravascular to interstitial compartment and to the formation of edema. Albumin is also the most important transport protein in plasma – it participates in the transport of unconjugated bilirubin, FA, thyroid hormones, ions (Ca2+, Mg2+, Zn, …) or drugs (penicillin, digoxin, salicylates). When the concentration of one of the transported substances exceeds certain limit, other substances might show up in blood plasma at higher concentrations as well. The reason is a competition for the binding place on albumin and a replacement of substances by other, which are present at high concentration.
Interzone albumin / alpha-1
HDL
Alpha-1 fetoprotein (AFP): a protein synthesized during the fetal development and used in prenatal diagnostics (part of triple test). High levels of AFP are associated with higher risk of neuronal defect. In adults, increased concentrations can indicate liver carcinoma.
Alpha-1 acid glycoprotein (orosomukoid)
2) Alpha-1 fraction
Alpha-1 antitrypsin: APR protein, belonging to the group of proteases inhibitors (it inhibits elastases, collagenases, …). Proteases are produced at increased rate during various infections (e.g. by bacteria and macrophages) and the function of their inhibitors is to decrease their activity that might be contra-productive.
Interzone alpha-1 / alpha-2
Alpha-1 antichymotrypsin: proteases inhibitor and APR
3) Alpha-2 fraction
Alpha-2 macroglobulin: endoprotease inhibitor (trypsin, chymotrypsin), its plasmatic level depends on age (lower in childhood). Elevation is observed in nephrotic syndrome, because unlike other proteins, alpha-2 macroglobulin is too large to pass to the urine even through damaged glomerular membrane.
Haptoglobin: a protein binding and transporting free hemoglobin. Complexes of haptoglobin-hemoglobin are quickly taken up by RES and metabolized. It therefore prevents the loss of iron in urine and it acts as an antioxidant.
Ceruloplazmin: the major copper-carrying transport protein in blood (transporting 90 % of Cu, the remaining 10 % is provided by albumin).
4) Beta fraction
Transferrin: the major iron transport protein, able to bind two Fe3 cations. By binding Fe it acts as an antioxidant.
C-reactive protein (CRP): belongs to APR and its concentration (normally below 10 mg/l) rapidly rises during acute bacterial infection.
Fibrinogen: fibrous protein, coagulation factor (factor I), normally present in concentrations 1.5 to 4.5 g/l. Belongs to APR.
Hemopexin: binds and transports free heme.
C3 component of complement
LDL
5) Gamma fraction
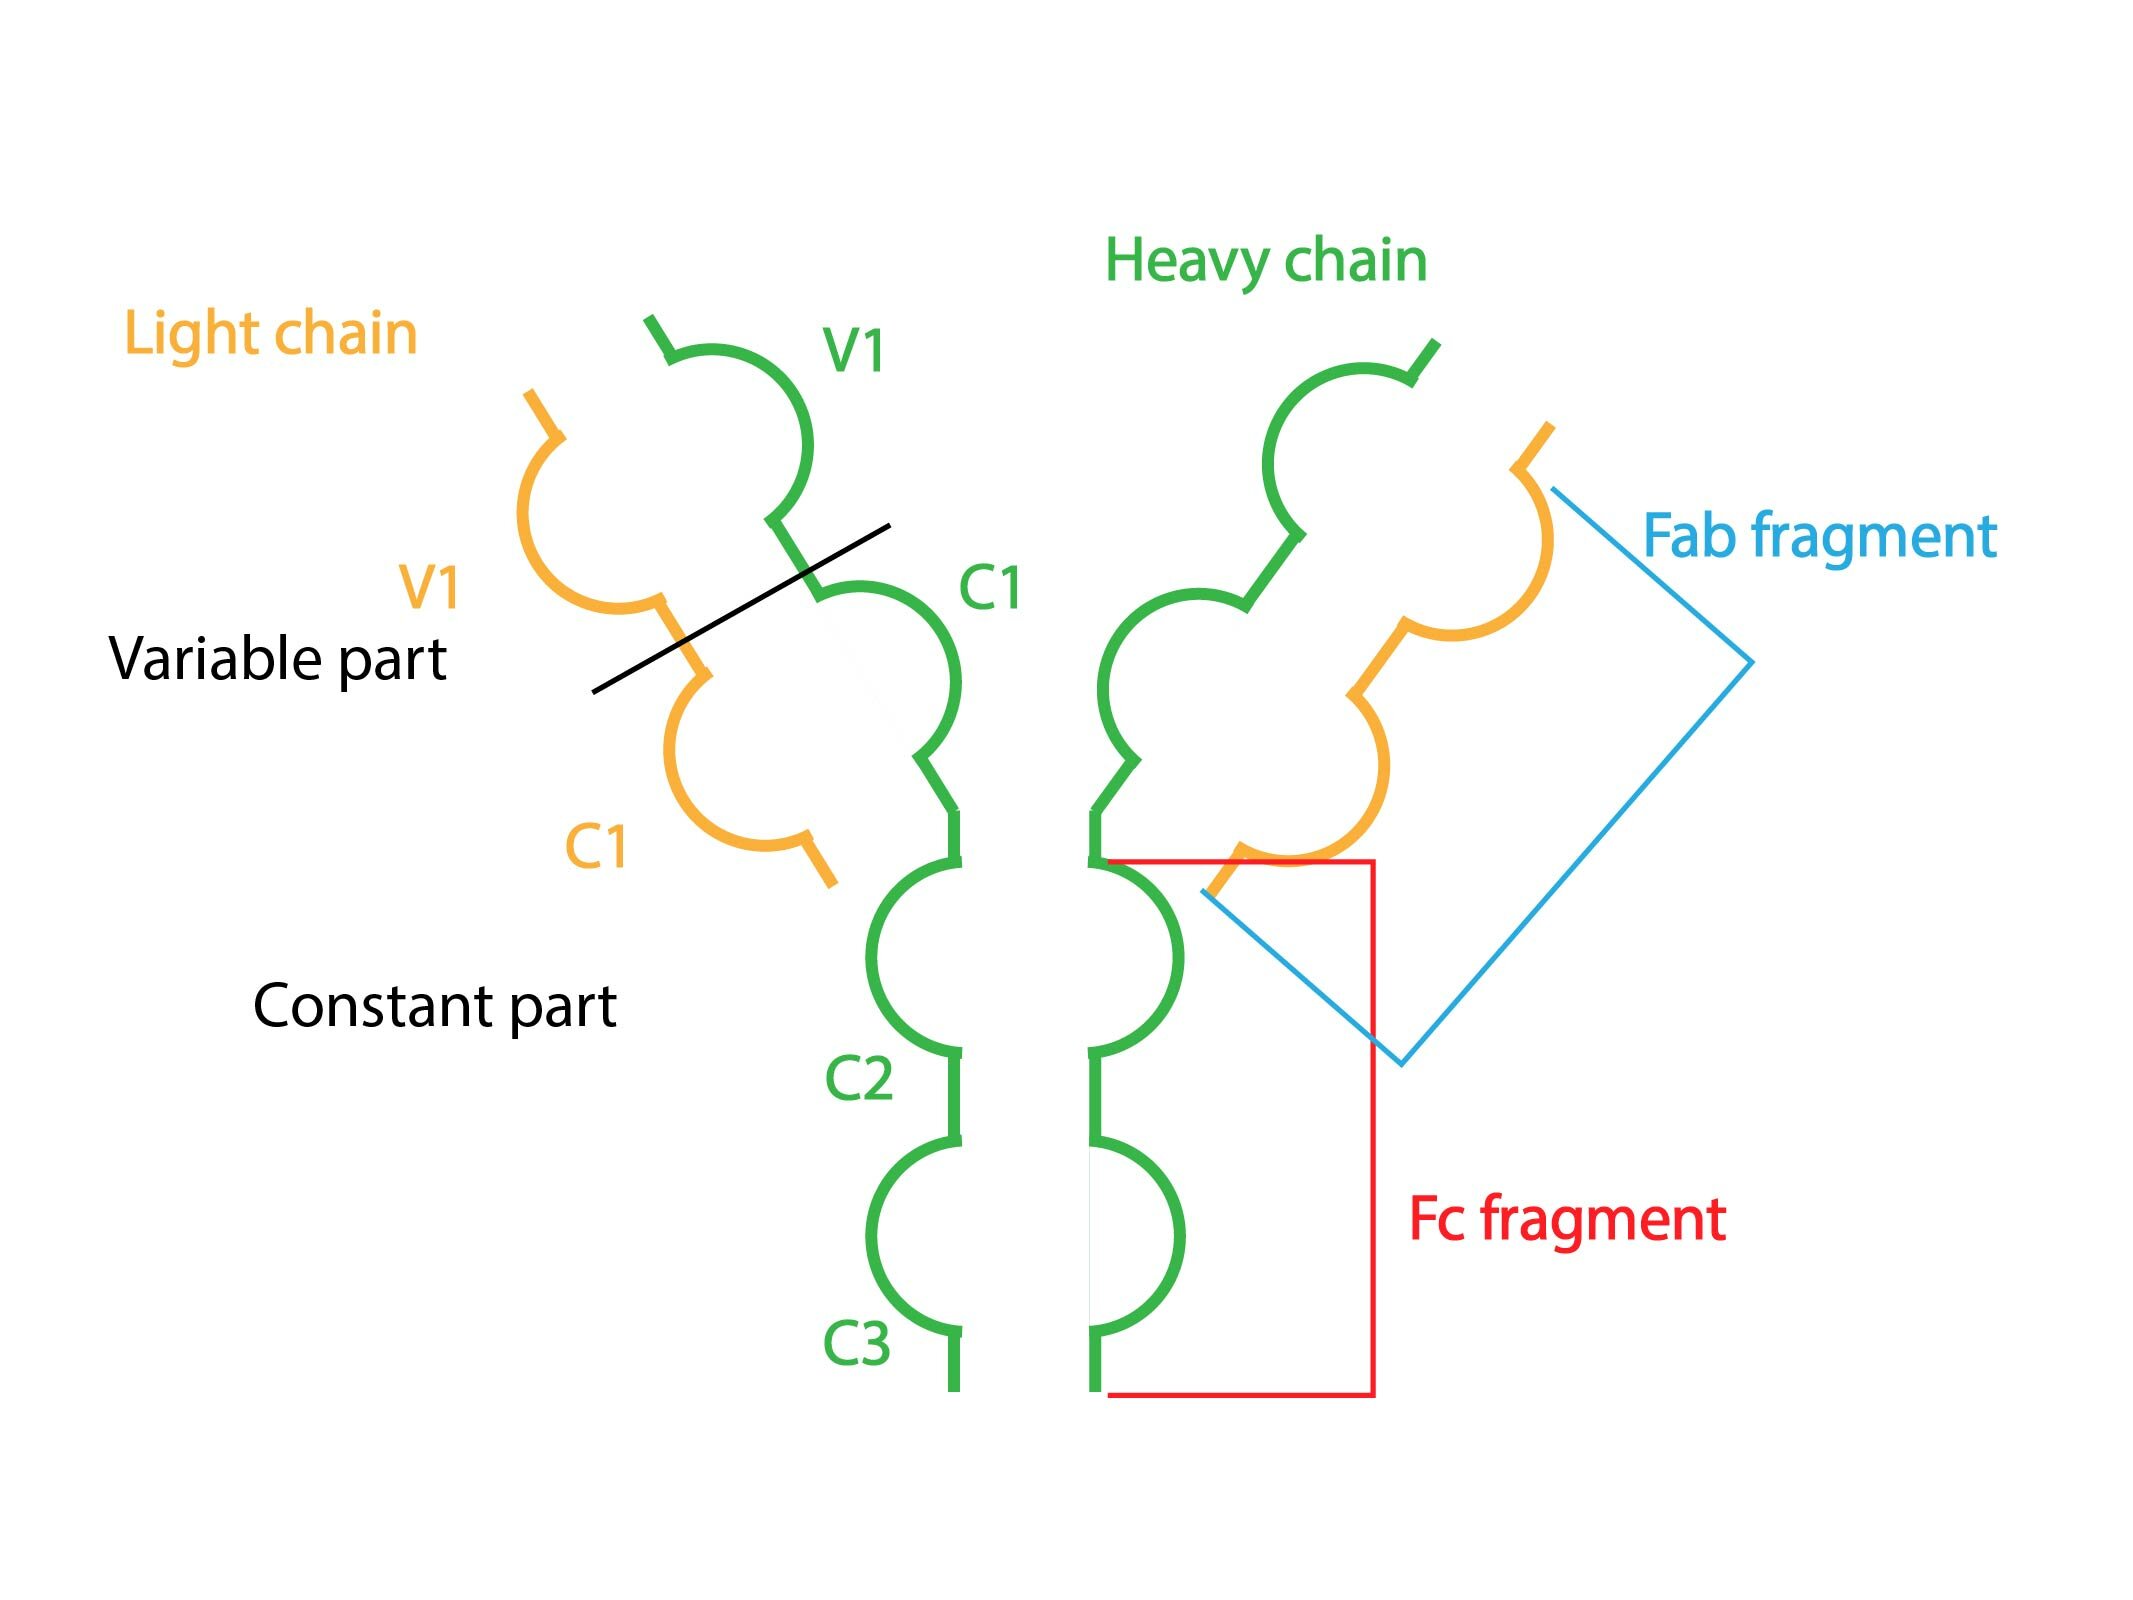
Gamma fraction is made of gammaglobulines (immunoglobulins, Ig or antibodies), which are unlike other plasma proteins synthesized by plasma cells. Their structure consists of two pairs of heavy and two pairs of light chains bound together by S-S bridges.
According to heavy chains, we recognise five classes of gammaglobulines: IgA, IgG, IgM, IgD and IgE.
APR (acute-phase reactants)
APR represent a group of proteins that is a part of non-specific immune response, activated in reaction to an action of various stressors. Their production in liver is stimulated via pro- inflammatory cytokines (IL-1, IL-6 and TNF-α). Examples are: CRP, alpha-1 antitrypsin, haptoglobin, coagulation factors or complement components.
Pathological changes of plasma proteins
Concentrations of plasma proteins can be altered by a variety of pathological states often leading to characteristic changes in electrophoretic curve. Below is the overview of the most typical cases:
1) Acute infection
Characterised mainly by an increased APR synthesis, resulting in the rise in both alpha-fractions. Due to an increased catabolism, the level of albumin may slightly decrease.
2) Chronic infection
The curve shows a rise in gamma fraction – in all of its components (called polyclonal hyperimmunoglobulinemia) and also a slight increase in alpha fractions (APR synthesis).
3) Chronic hepatopathy
Severe liver fibrosis or cirrhosis often leads to the state of chronic hepatopathy. Liver synthetic function is impaired, leading to the decrease in proteins produced in liver (albumin, alpha and beta fractions). Gamma fraction, on the other hand, increases due to the presence of a chronic inflammation. Sometimes an increased part of the curve is observed between beta and gamma fraction (so called β-γ bridge), consisting of increased IgA.
4) Nephrotic type
Impairment of the function of glomerular filtration membrane (nephrotic syndrome) leads to protein loss. The largest decline is seen in the smallest proteins (albumin, gammaglobulines). Proteins with relatively higher Mr increase their relative share in plasma (thanks to the triggered proteosynthesis, trying to supplement the losses) – e.g. α2– macroglobulin, β-lipoprotein.
5) Monoclonal hyperimmunoglobulinemia (monoclonal gammopathy)
Often seen in malignancies, which are characterised by a clonal production of only one type of Ig (paraprotein). The electrophoretic curve has a narrow, high band (or spike) located anywhere in beta or gamma fraction.
6) Hyperimmunoglobulinemia
It is cause by the primary or secondary antibody production deficit or due to an increased loss of immunoglobulins. We usually find a generalised decline in gamma fraction.
7) Malnutrition type
A long-term dietary deficit leads to a significant decrease in albumin. Other protein fractions may be reduced as well.
Subchapter Authors: Petra Lavríková and Josef Fontana
![]()