Content:
1. Introduction to the intermediary metabolism
2. Starve – feed cycle
3. Physical activity
_
Introduction to the intermediary metabolism
In Chapter 2 we have described various metabolic pathways and their regulation. During this section we will try to put this knowledge into the context of the whole body, look at their relationships and answer a few basic questions – What? Where? When? How? Why? An objective for us is to understand the changes and transformations in the intermediary metabolism during the stave-feed cycle. Later, in this chapter we will address the issue of metabolism during physical activity.
Before we focus on the individual metabolic situations, we have to define some important terms.
Energy and basic parameters of individual nutrients
Energy can be measured in two basic units. SI unit is called the joule – J (Nm), second unit is the calorie – cal:
1 cal = 4.18 J
1 J = 0.239 cal
One calorie is defined as the energy needed to heat 1 g of water by 1 °C (from 15.5 °C to 16.5 °C). In the energy metabolism as well as in medicine, we often deal with their multiples – kilojoule (kJ) and kilocalorie (kcal „large calorie“):
1 kcal = 4.18 kJ
1 kJ = 0.239 kcal
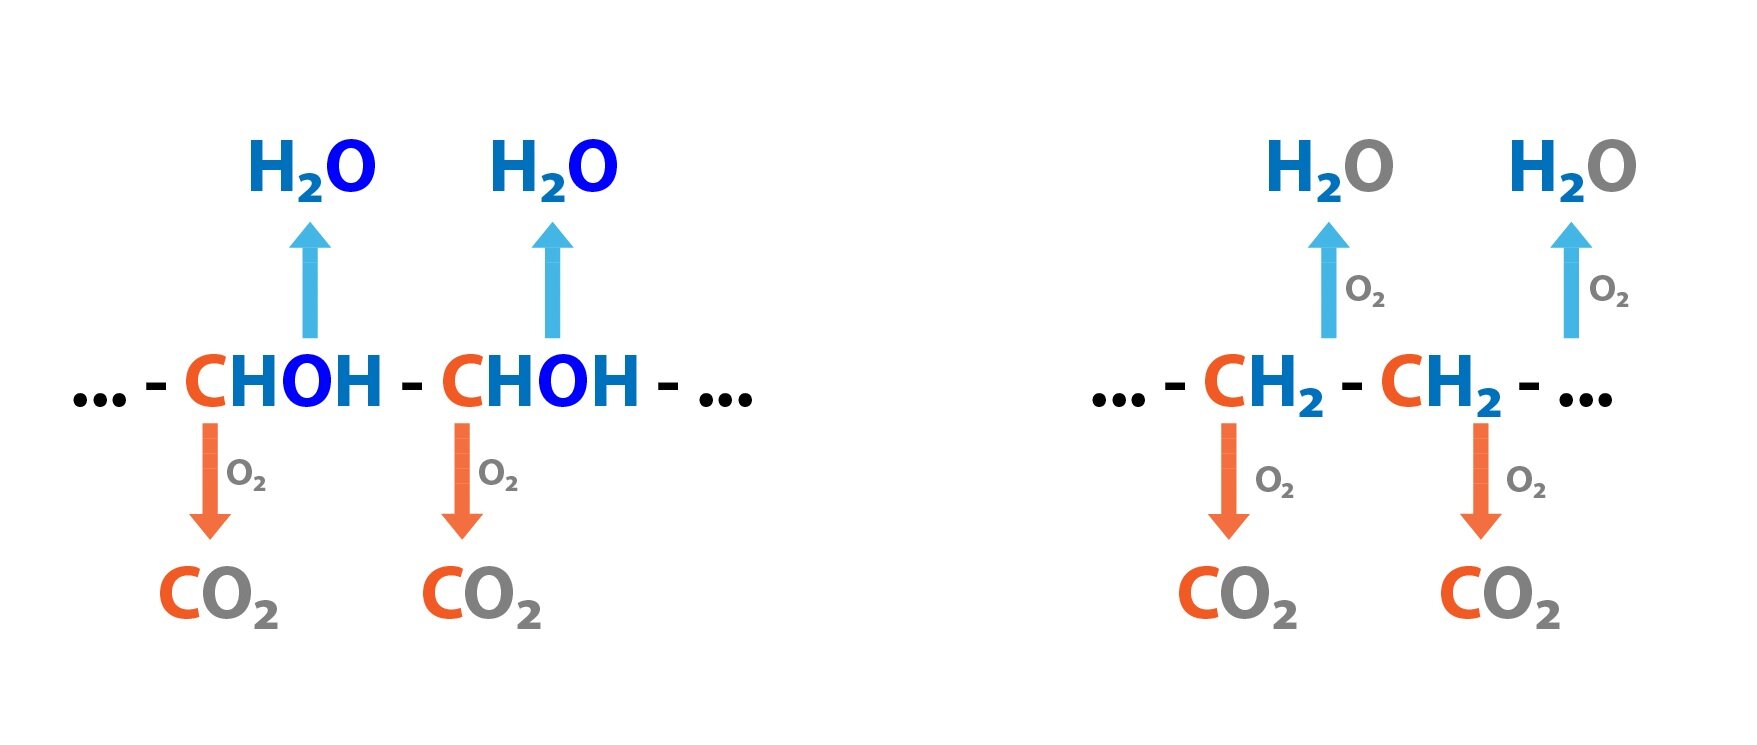
Catabolism (oxidation) of nutrients requires oxygen and leads to the production of CO2 and H2O. In the case of amino acids (proteins) must be further resolved the fate of nitrogen that they contain. Under normal metabolic conditions, 95 % of the amino nitrogen is converted into urea and the remaining 5 % is excreted as ammonia (transported in the blood as glutamine). Approximately 5 g of protein/day is excreted in faeces and through skin. 6.25 g of protein gives approximately 1 g of N.
Nitrogen balance reflects the balance between the intake of nitrogen in food (dietary nitrogen) and nitrogen losses (simply the amount of nitrogen excreted in the urine). Most healthy individuals will present with the nitrogen balance in equilibrium (N intake = N losses). If the amount of protein in the diet increases, the excess amino acids are catabolized and their amino group excreted as urea or ammonia. A positive nitrogen balance means that the protein intake in the diet exceeds the protein losses. This occurs during the recovery after illness, during periods of growth or during an administration of anabolic hormones. The negative nitrogen balance occurs when nitrogen losses exceed its intake, for example during starvation, severe illness or during an administration of catabolic hormones.
Now we define some basic terms – respiratory quotient (RQ), nutrition energy content, energy equivalent and energy expenditure.
Respiratory Quotient (RQ) is calculated as the amount of CO2 produced to the amount of O2 consumed. For various nutrients it takes on different values. It is low for lipids – 0.71, followed by amino acids (proteins) – approximately 0.83 and maximal value reaches for saccharides – 1.0. During anaerobic metabolism it can be > 1.0.
1 g glucose + 0.747 l O2 → 0.747 CO2 + 0.6 g H2O RQ = 1.0
1 g protein + 1.031 l O2 → 0.859 l CO2 + 0.4 g H2O + 0.16 g N RQ = 0.83
1 g TAG + 2.023 l O2 → 1.436 l CO2 + 1.07 g H2O RQ = 0.71
Under the nutrition energy content we understand energy released by the oxidation of 1 g of nutrients. In the case of saccharides and lipids, it is the same whether the oxidation occurs outside the body (so-called direct calorimetry) or in the body. For saccharides it is 4.1 kcal/g, for lipids it is more than double – 9 kcal/g (lipids thus store more energy than saccharides). In the case of amino acids (proteins), the situation is somewhat more complicated. Their oxidation in the human body is not complete, and therefore the amount of energy generated by body is lower – 4.1 kcal/g (as for saccharides) than the amount obtained by the direct calorimetry – 5.3 kcal/g
The energy equivalent indicates the amount of energy released during oxidation with 1 l O2. Its value is approximately 4.82 kcal/l. The exact amount of energy released depends on the oxidized substance: saccharides – 21.1 kJ (5.05 kcal), proteins 18 kJ (4.31 kcal) and lipids 19 kJ (4.55 kcal).
The energy expenditure (EE, Energy Expenditure) is the amount of energy consumed per defined period of time.
Energy expenditure
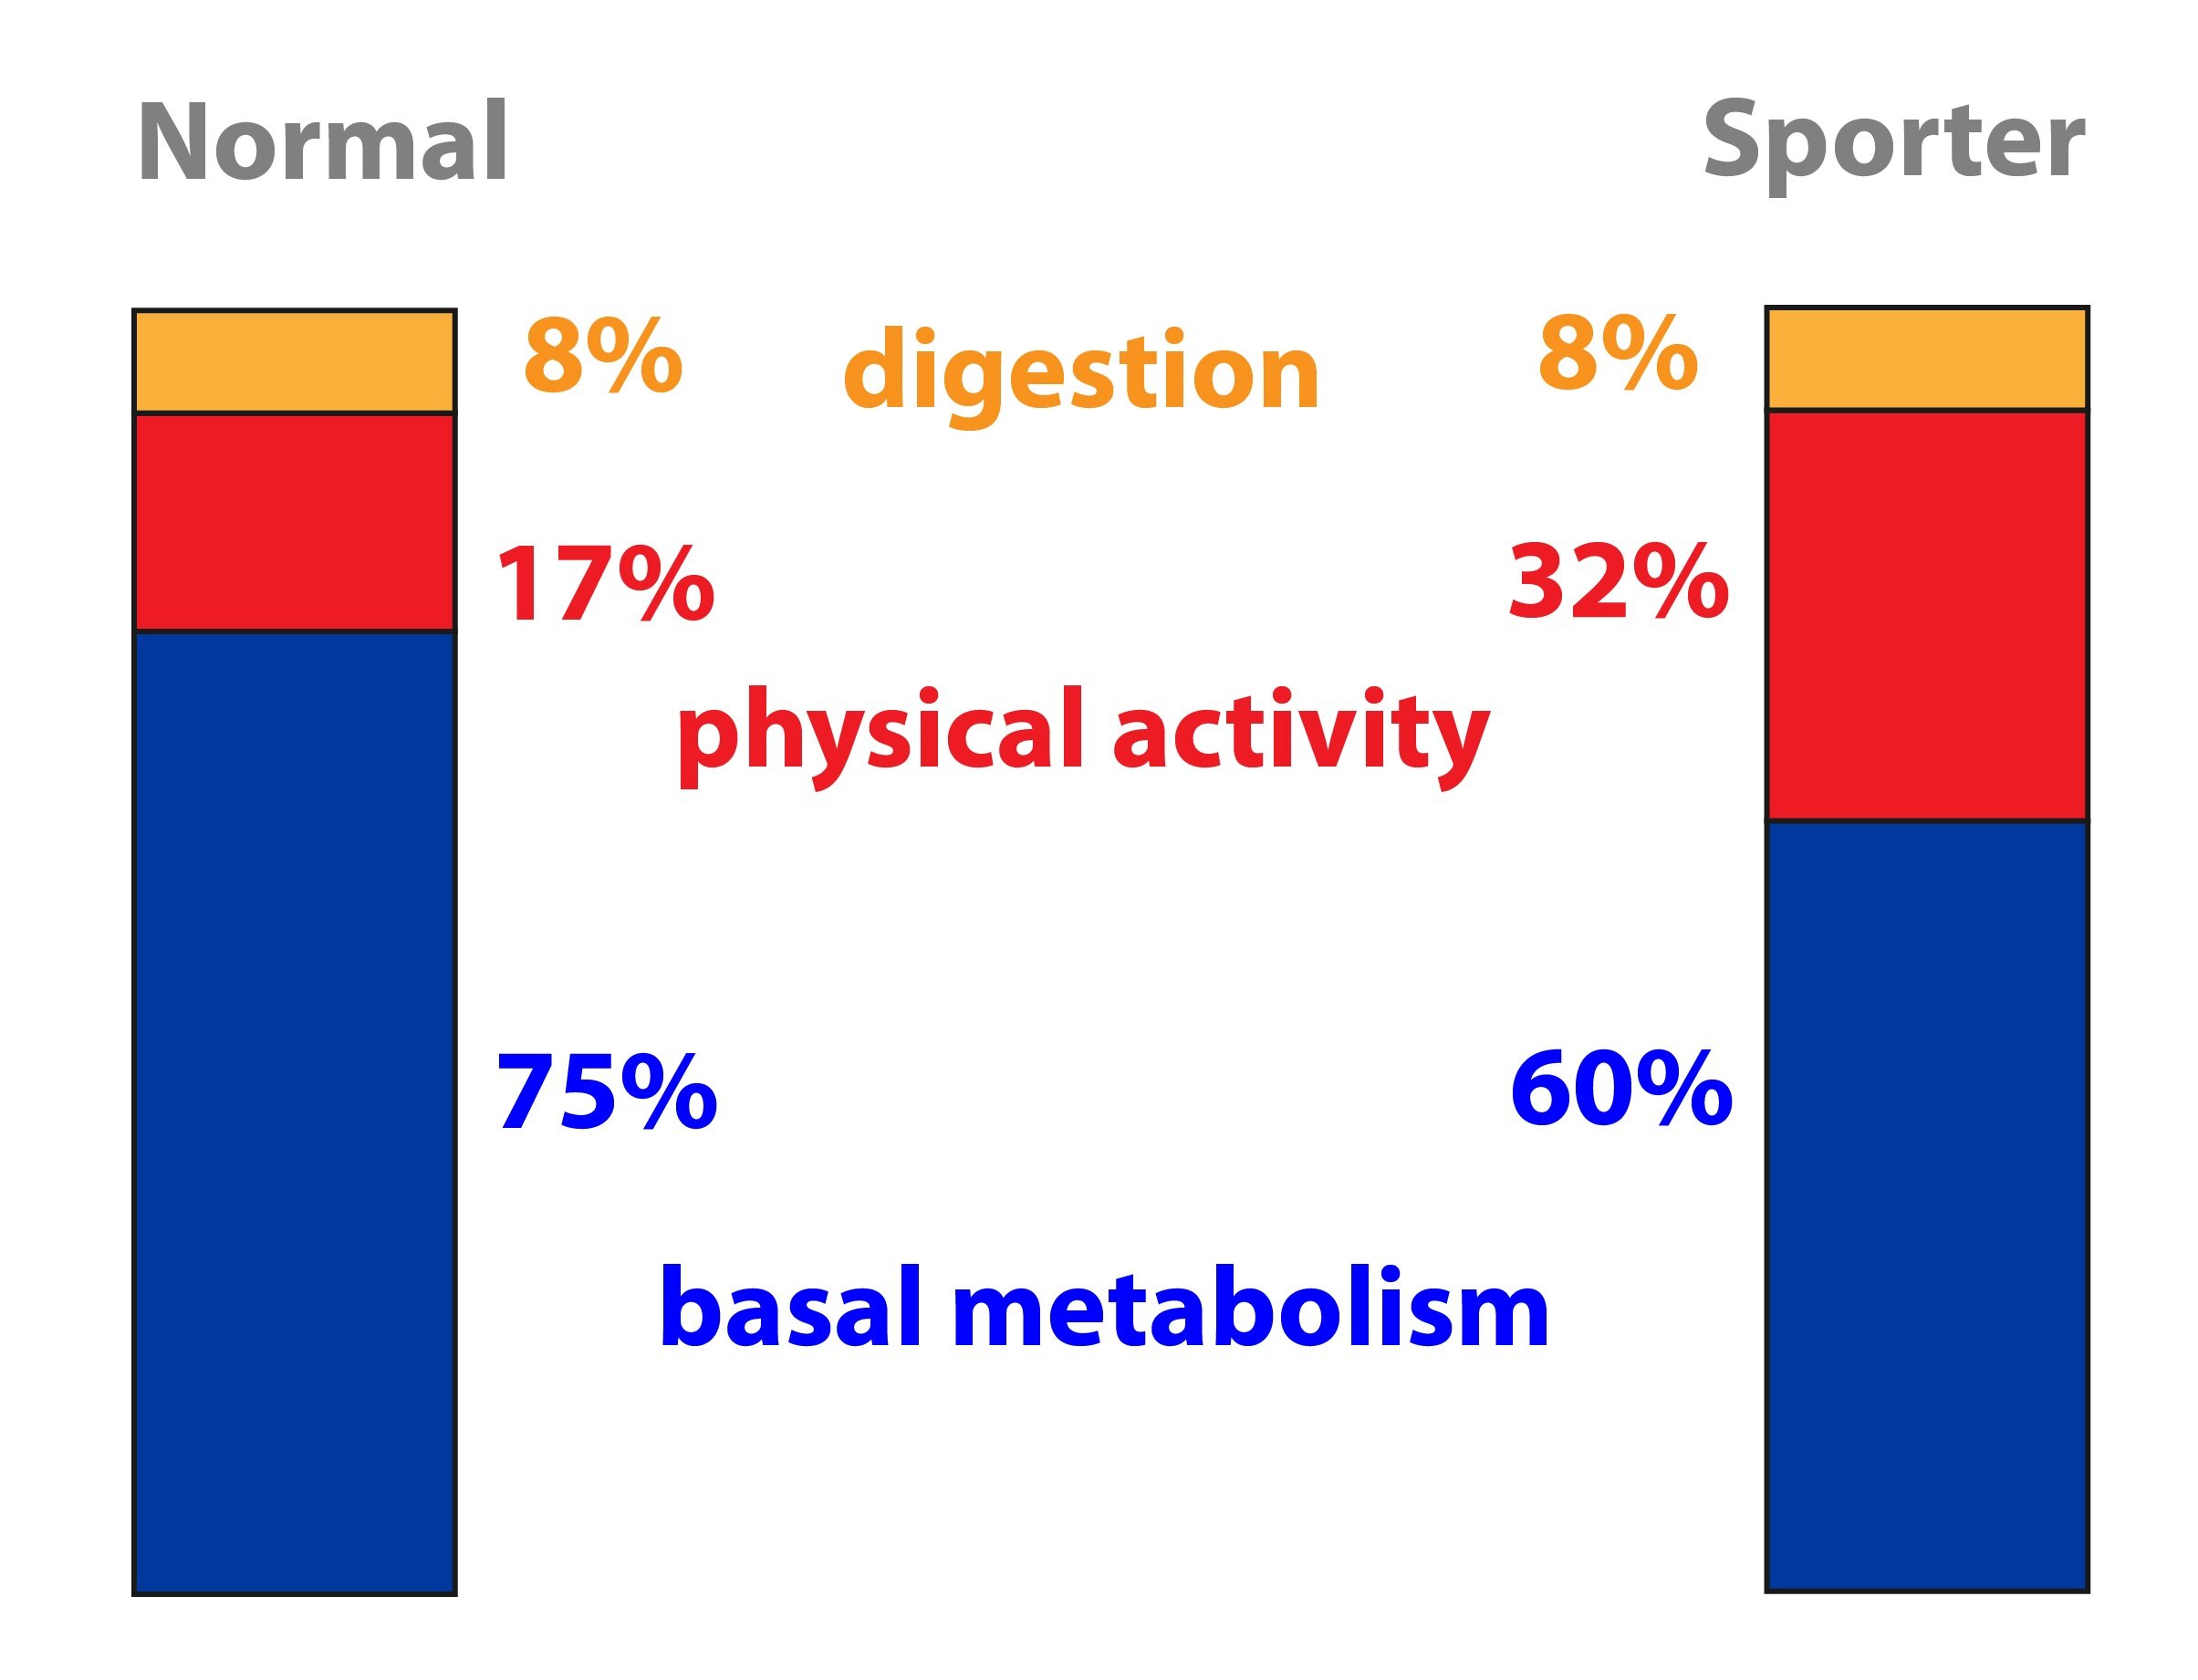
Energy expenditure consists of three components – basal metabolic rate (BMR about 60 %), diet-induced thermogenesis (about 10 %) and physical activity (about 30 %, but is the most variable component). Simply said, the BMR is approximately equal to 1 kcal/kg per hour, thus 24 kcal/kg per day. Its value depends for example on gender (men > women), age (younger > older), body temperature and hormone levels (stress, thyroid hormones etc.).
BMR is defined as the amount of energy consumed in a thermally neutral environment, 12 hours after the last meal (excluding the effect of food and GIT activity), observed person must be overall idle (CNS must be also in a rest). BMR is therefore the amount of energy needed to maintain basic vital functions under basal conditions.
There are several formulas to estimate BMR. The one most often cited is from 1918 described by Harris and Benedict – the Harris-Benedict equation for which we need to know gender, age, height and weight:
Harris-Benedict equation for women (BMR is calculated in kcal/day):
BMR = 655.0955 + (9.5634 × weight in kg) + (1.8496 × height in cm) – (4.6756 × age in years)
Harris-Benedict equation for men (BMR is calculated in kcal/day):
BMR = 66.473 + (13.7516 × weight in kg) + (5.0033 × height in cm) – (6.755 x age in years)
In clinical practice we rarely measure the exact value of BMR, it is usually sufficient to do the estimation of BMR using following calculation:
EE = BMR x IF x AF x TF
IF (injury factor) – without stress 1.0; elective surgery 1.1; septic shock 1.5
AF (activity factor) – artificial ventilation 0.9; bed-rest 1.0, outpatients or actively rehabilitating 1.5
TF (temperature factor) – 37 °C is 1.0, modified by 0.1 for each degree of body temperature
If it is necessary to have an accurate determination of energy expenditure, it is most often used a indirect calorimetry method based on the principle of measuring the consumption of O2, excretion of CO2 and nitrogen excretion.
Energy Homeostasis
Energy balance is the ratio of energy intake to its expenditure. Positive balance leads to obesity, negative balance leads to malnutrition. The hypothalamus is considered as the centre for food intake. Lateral hypothalamus is considered as a center of hunger and the medial hypothalamus (ventromedial nucleus) as a satiety center. Afferent signals are for example hormones – leptin (indicates amount of fat stores), ghrelin, cholecystokinin and incretins (presence or absence of food in the GIT). For more information, see Chapter 12.
_
Starve-feed cycle
Well-fed state
Well-fed state (after a meal) is characterized by an increased ratio insulin / glucagon (ratio is elevated due to an elevated insulin levels – hyperinsulinemia) and a sufficient supply of nutrients from the gastrointestinal tract, which can cover the energy requirements of cells (increase in concentration of glucose and amino acids comes approximately 30 minutes after a meal). Generally, there is an elevated activity of the gastrointestinal tract, liver and pancreas. Body enters the anabolic metabolism.
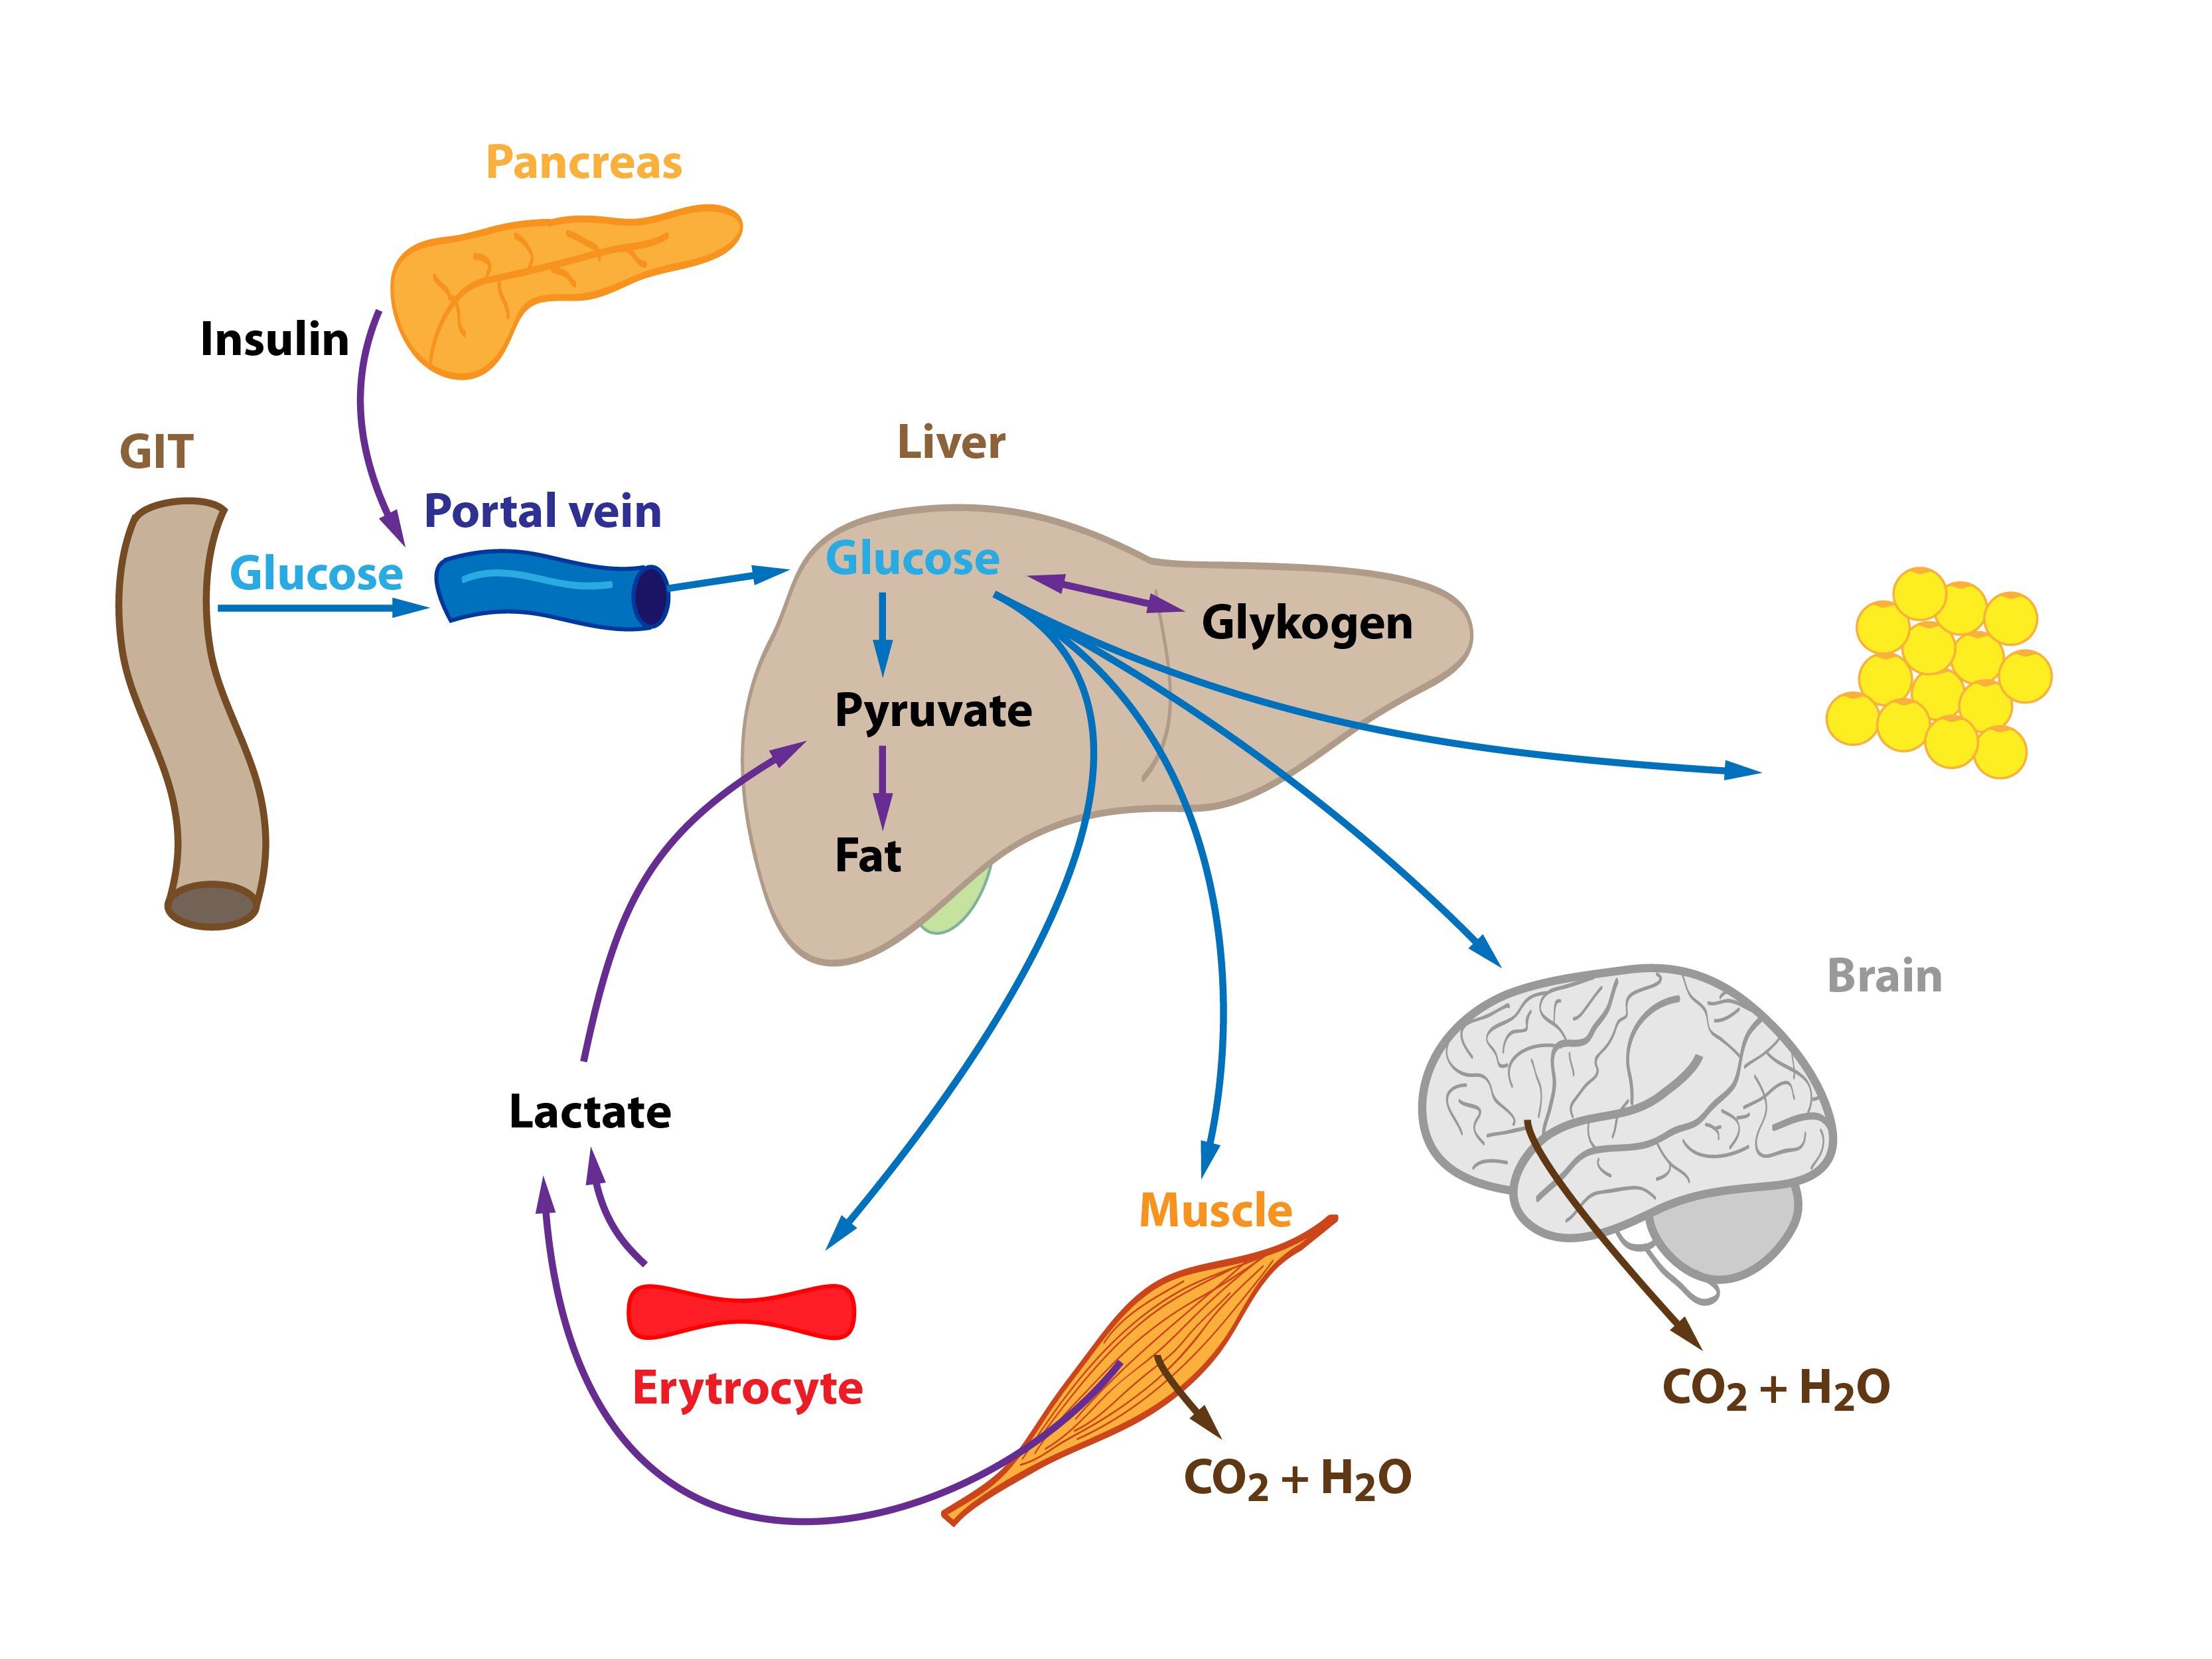
Metabolism of saccharides (glucose)
Glucose is released from enterocytes and transported through the portal vein to the liver. Liver therefore represents the first organ of the human body (with the exception of the gut) that comes in contact with glucose from food and can metabolise it. High levels of glucose in the portal blood trigger the synthesis of glycogen in the liver – the hepatocytes uptake glucose and form glycogen. If glycogen formation capacity is full (and there is still excess of glucose molecules), glucose is converted to fatty acids and subsequently to TAG. Gluconeogenesis plays a minimal role in this situation. Produced TAG are released into the blood in VLDL particles. They are metabolised in tissues by lipoprotein lipase, which is activated by insulin. Released fatty acids then enter cells (adipocytes, muscle cells etc.). Cori and alanine cycle are inhibited (lactate is drawn to the synthesis of TAG).
Some glucose molecules just pass through the liver and enter peripheral tissues. This glucose can be used by almost all cells of the human body. It is worth of mentioning (1) tissues strictly glucose-dependent (e.g. erythrocytes, cells of the CNS) as well as insulin-sensitive tissues (e.g. skeletal muscle, adipose tissue, insulin promotes the incorporation of GLUT-4 transporters into the membranes of these cells). Glucose can be burned for energy, stored in form of glycogen or transformed into other compounds (TAG).
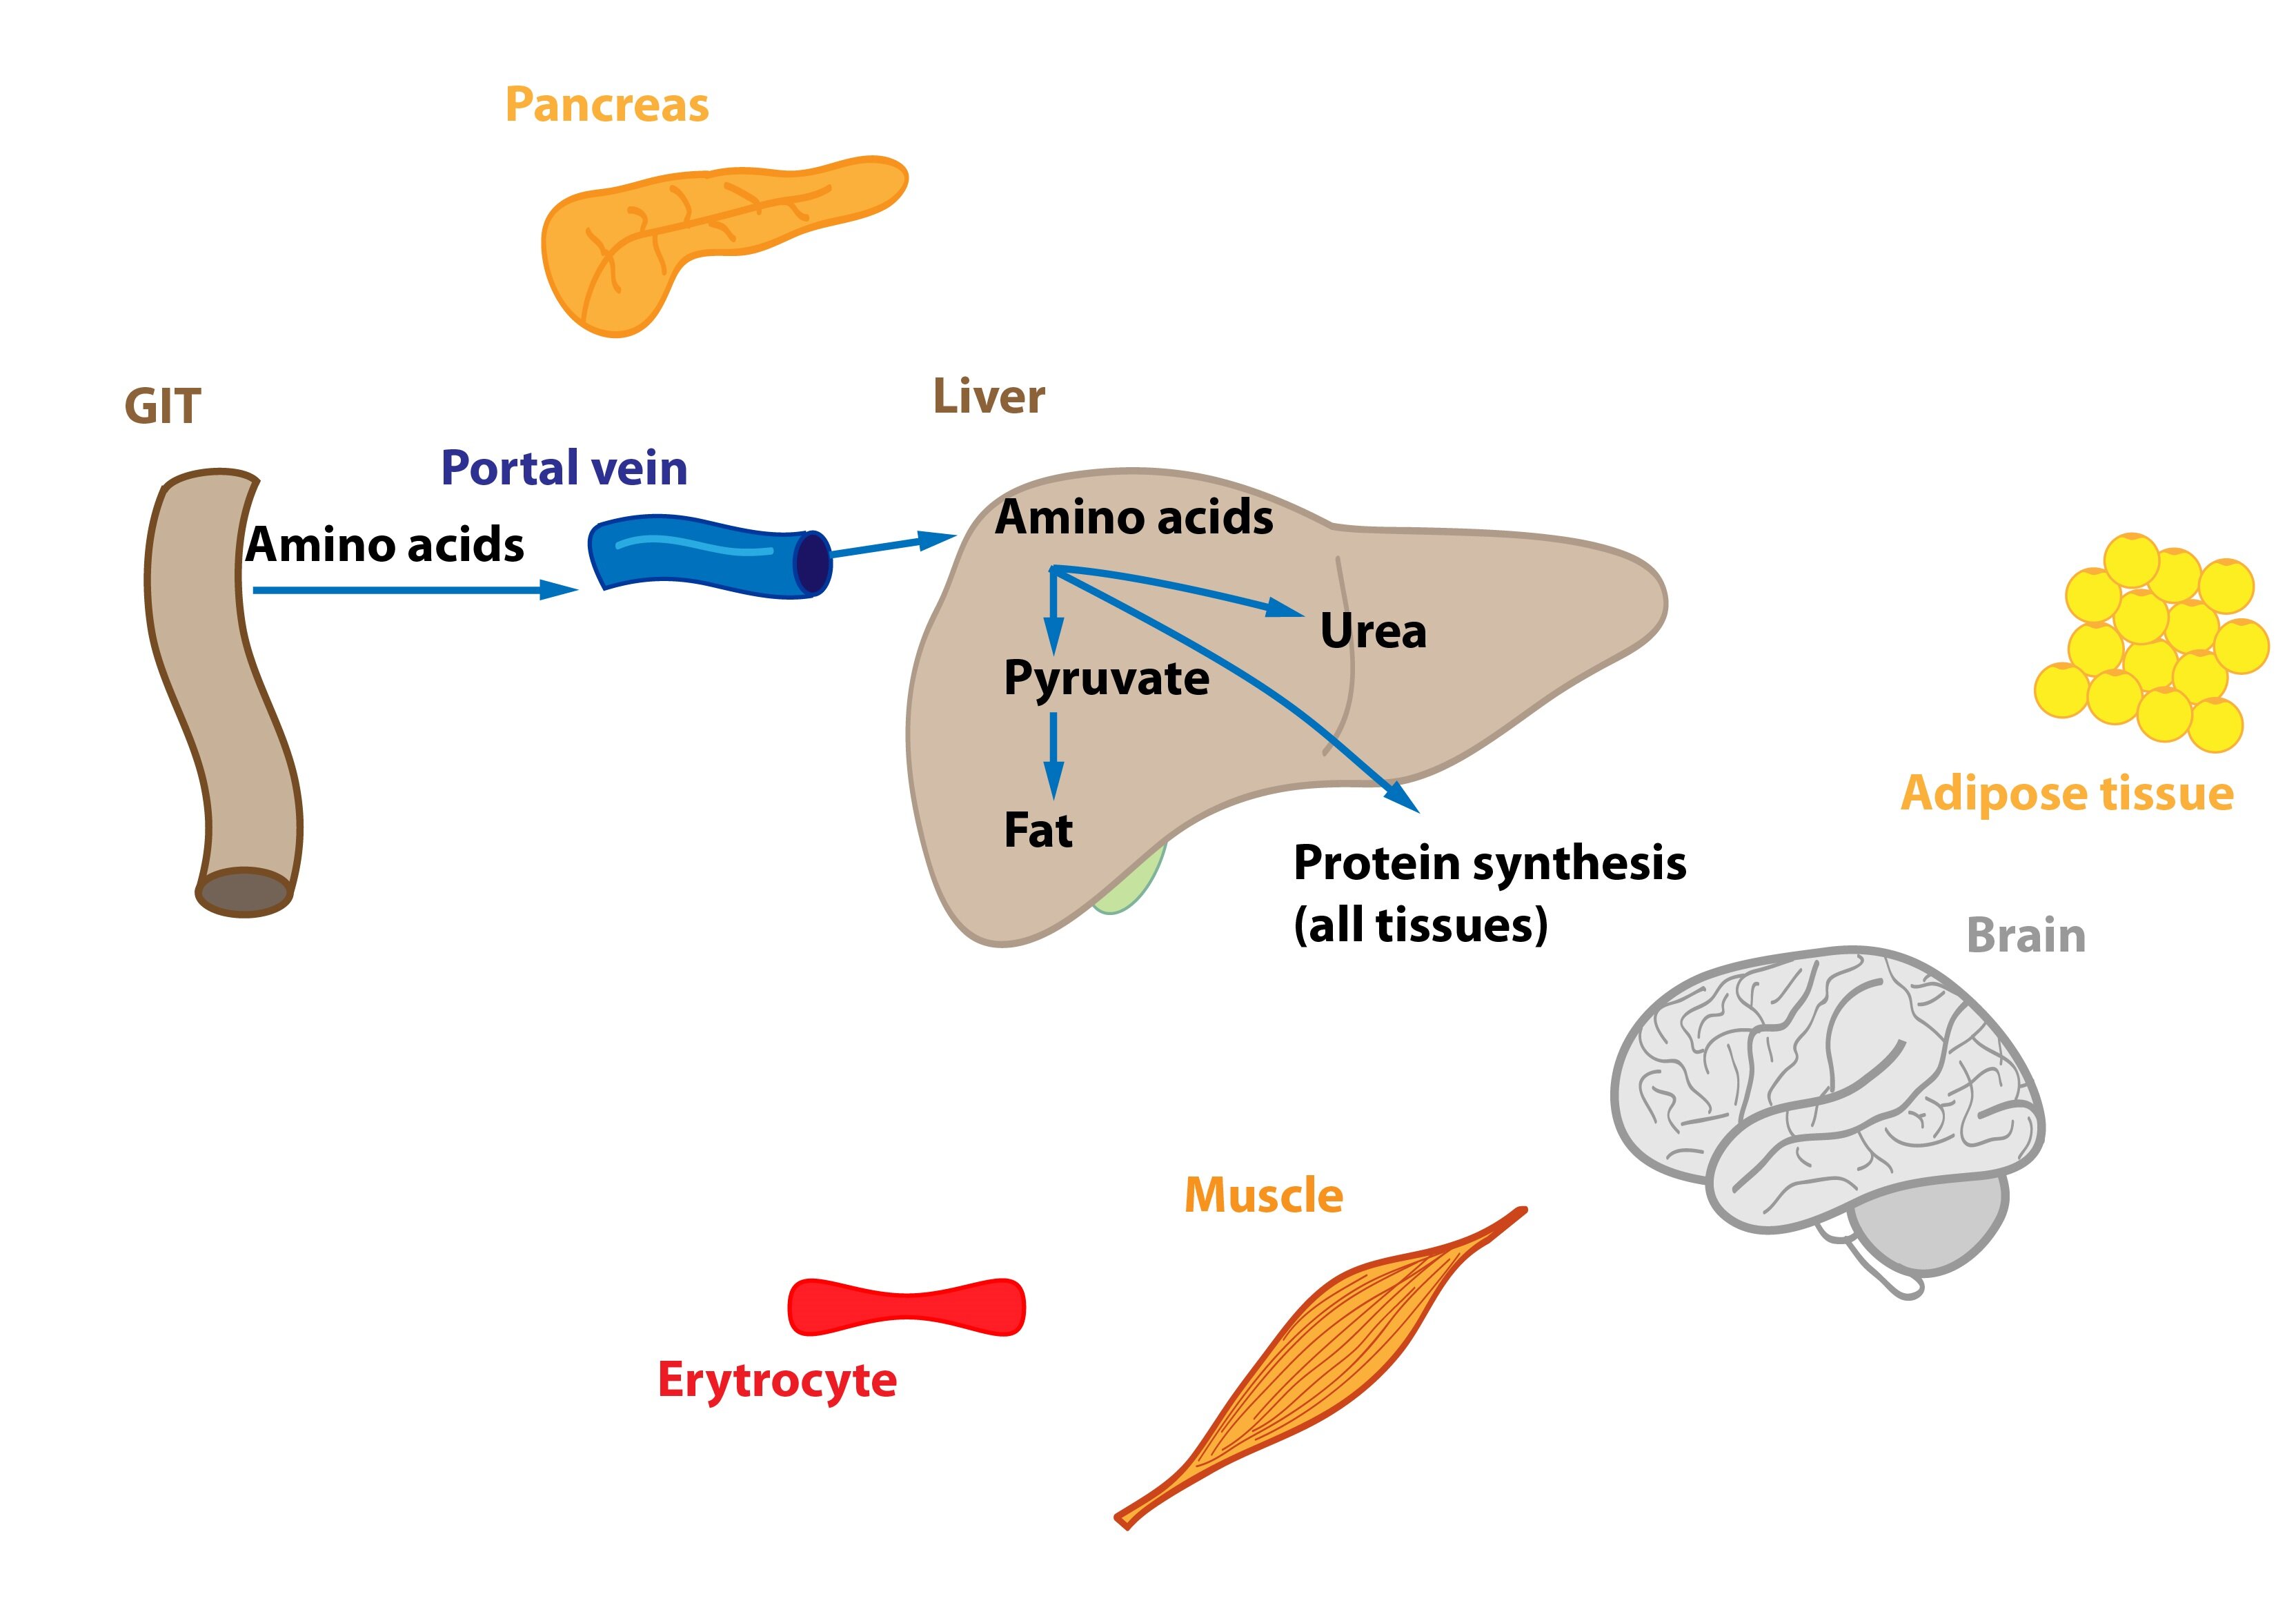
Metabolism of amino acids and proteins
Amino acids are partially metabolized in the enterocytes prior to their release into the portal blood (e.g. Asp, Asn, Glu, Gln are metabolized in enterocytes to Ala, lactate, citrulline, and Pro). Part of amino acids is utilized in liver cells – energy gain, transformation to TAG (VLDL) or proteins. This also increases rate of urea production. Some AA just pass through the liver, their fate is similar to those used by liver cells.
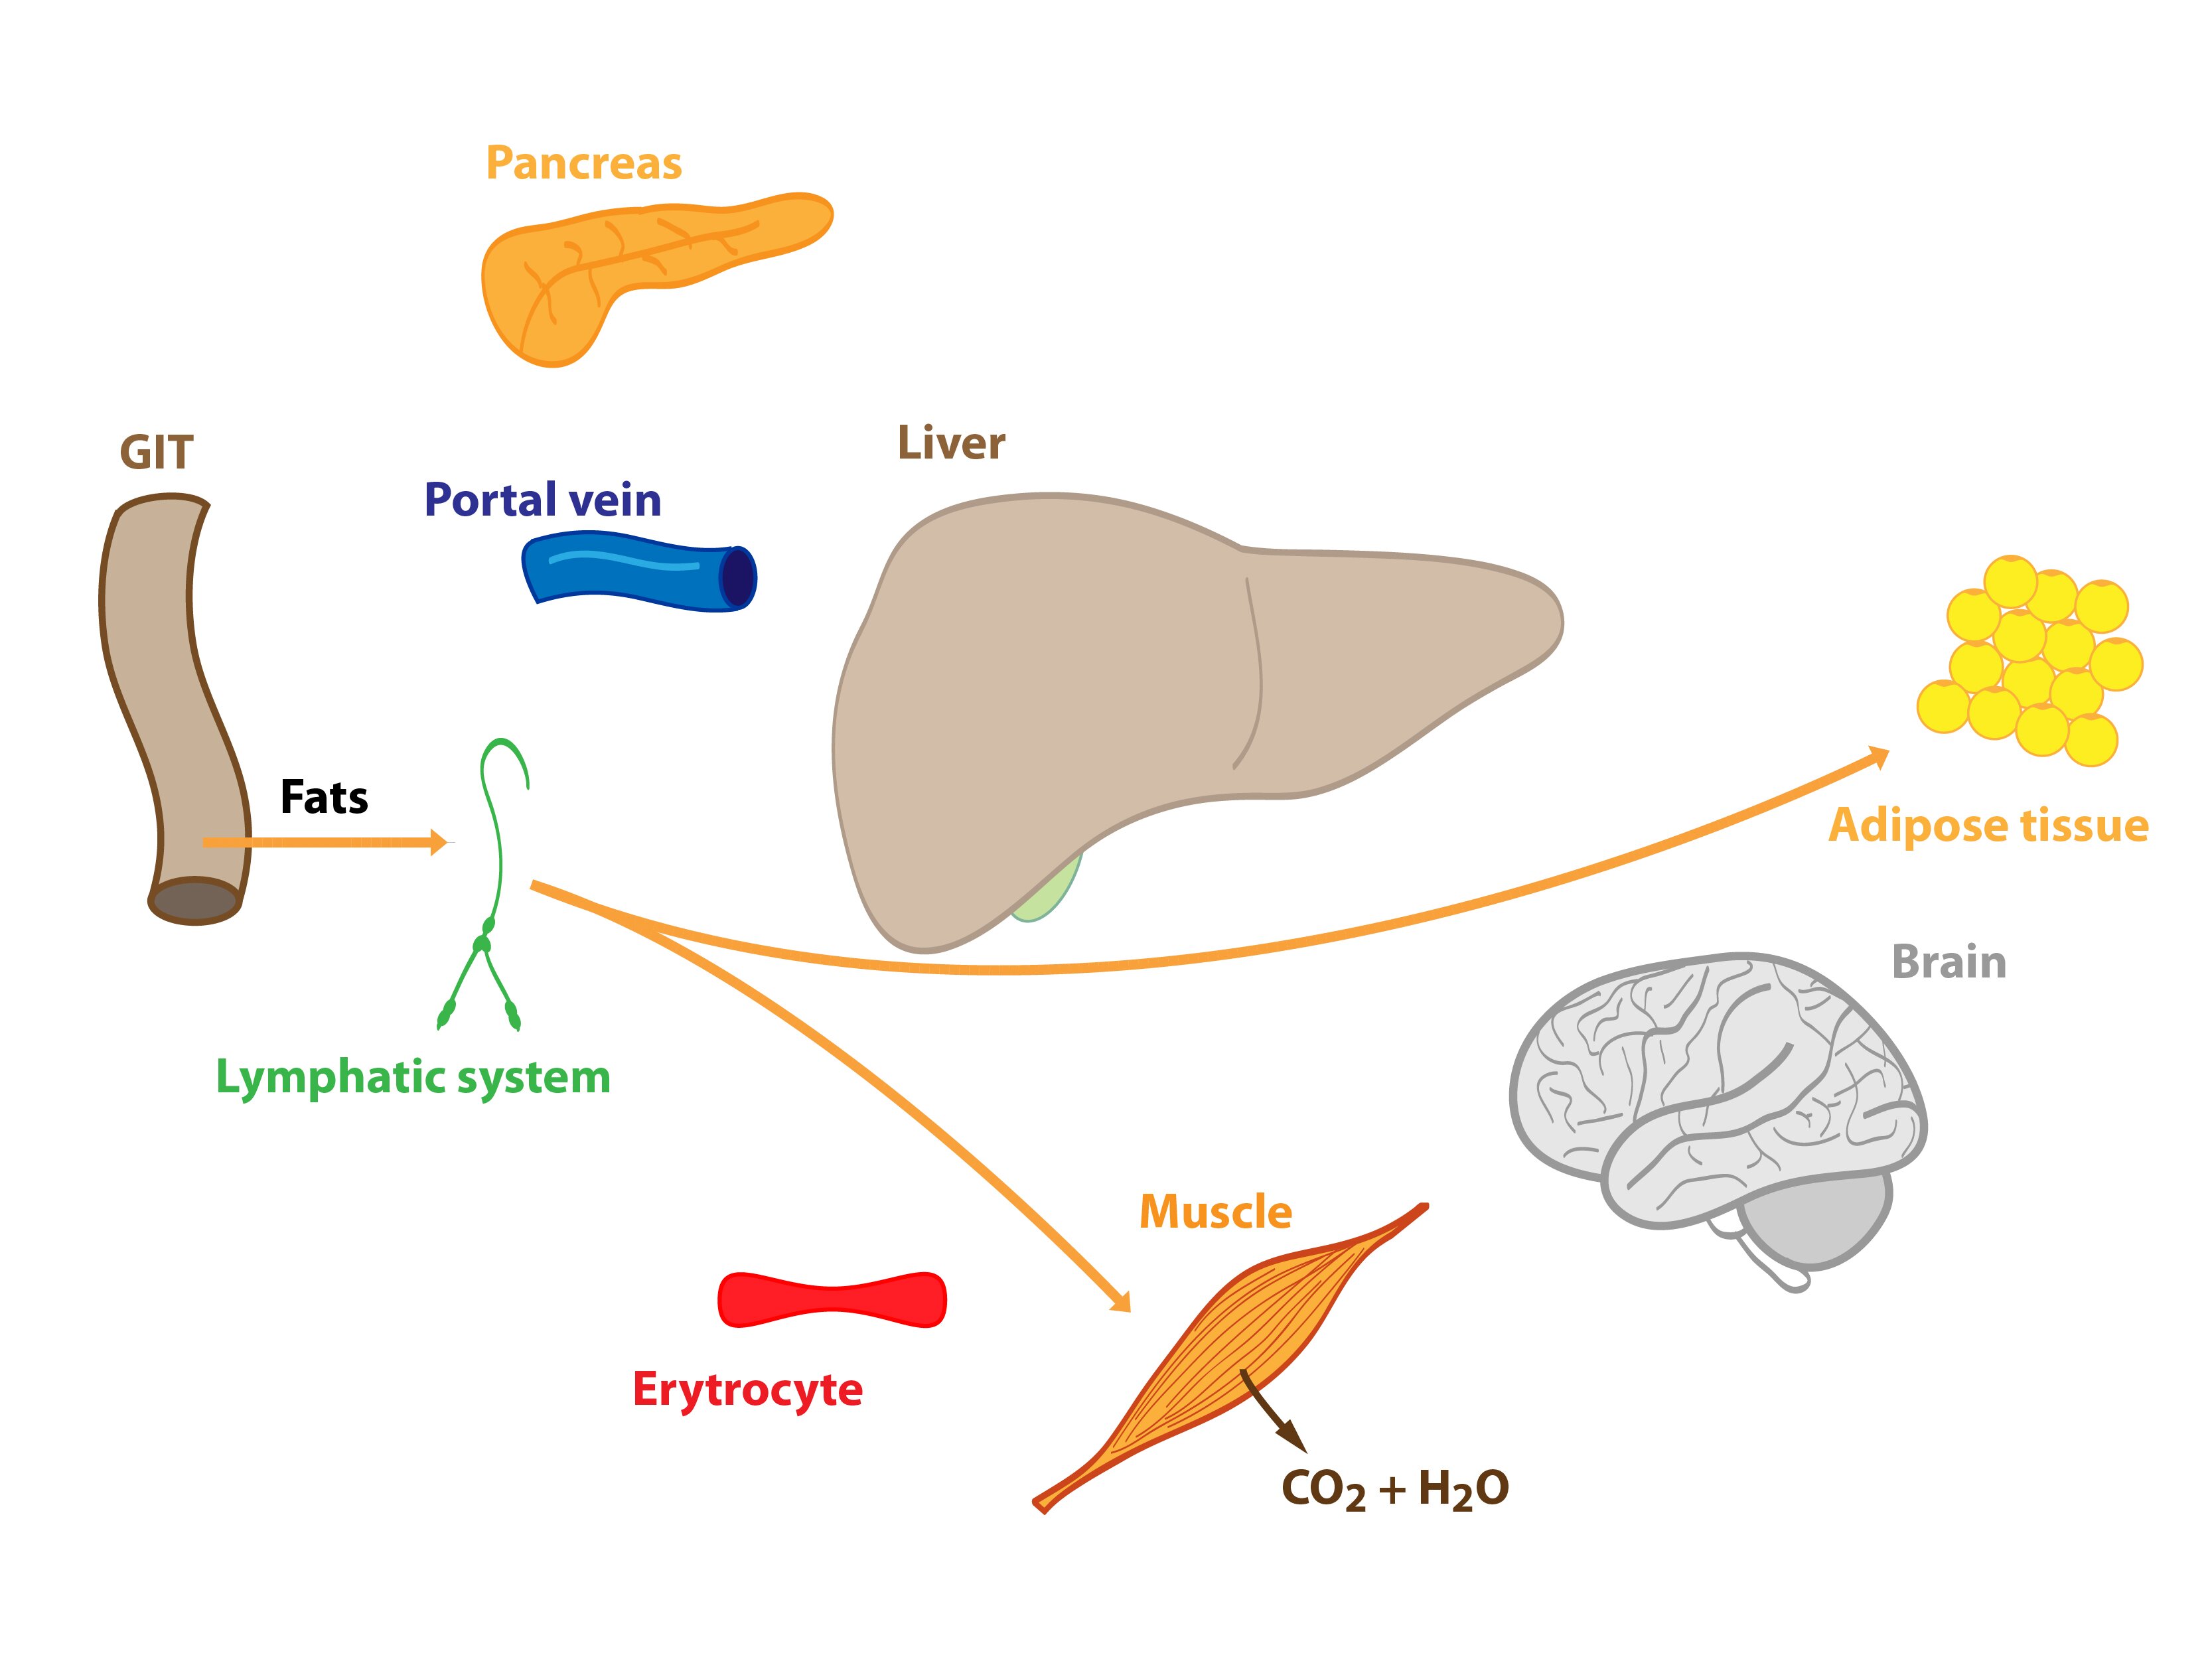
Lipid metabolism
Most of the absorbed lipids are incorporated by enterocytes into chylomicrons, which are transported through the lymphatic vessels and thoracic duct to the blood. Fatty acids shorter than 12 C can go directly into the portal blood. Both are used in the postprandial state as a source of energy (e.g. muscles) or stored in reserves (adipose tissue). Liver cells simultaneously synthesize VLDL from excess carbohydrates and amino acids. Their fate was described above. The maximum concentration of chylomicrons and VLDL is achieved 3-5 hours after a meal. Increased insulin / glucagon ratio enhances lipoprotein lipase activity, which metabolises lipoprotein particles, and the formation of TAG. The activity of hormone-sensitive lipase is on the other hand decreased.
Beginning of starvation
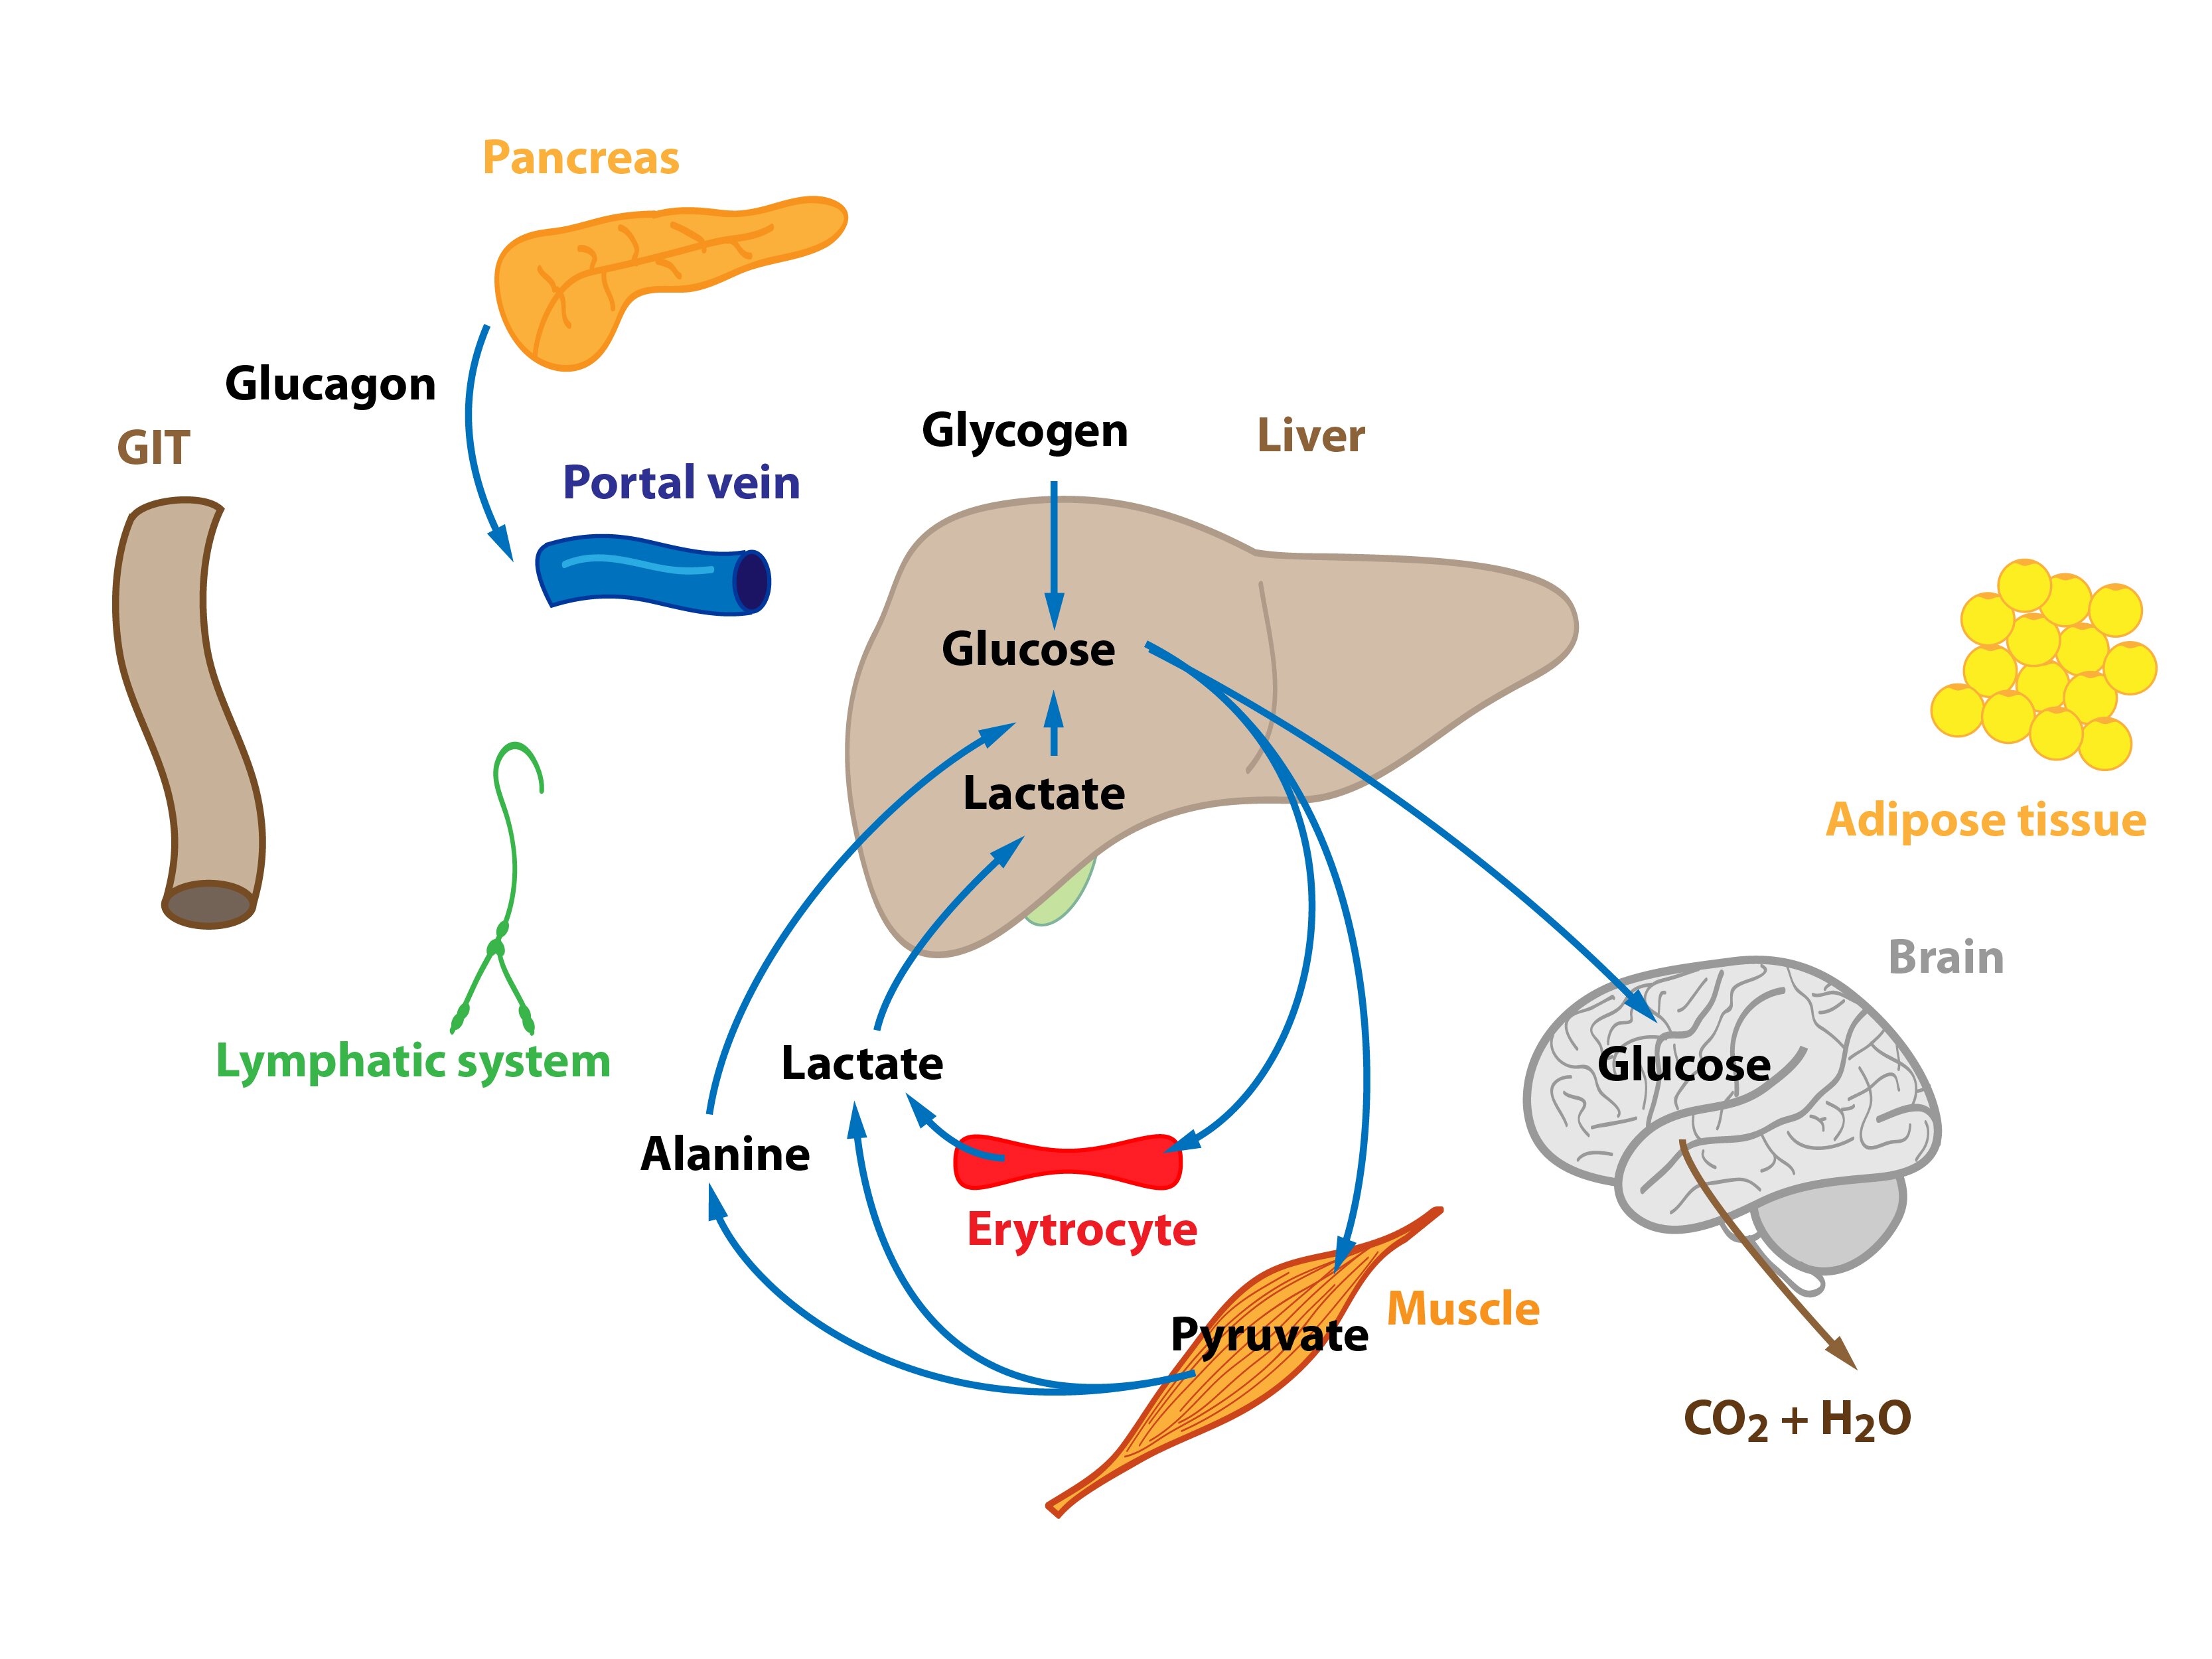
This situation occurs in the morning before breakfast. At the beginning of starvation the insulin / glucagon ratio changes (↓ insulinemia, ↑ glucagonemia). Degradation of liver glycogen (liver glycogenolysis) is a significant source of glucose molecules that are released to the blood. Amino acids, lactate and pyruvate are gradually utilized for gluconeogenesis – starting Cori and alanine cycle. Hepatic lipogenesis is decreased.
Adipose tissue releases fatty acids and glycerol (lipolysis) – both are used in the energy metabolism to cover energy needs of the body. Muscle cells slightly activate proteolysis.
Starvation
We can distinguish several types of starvation. In this section we describe the metabolic changes that take place during the so-called simple starvation – it occurs when you stop eating. In simple starvation, there are three basic stages – early, adaptation (protein-sparing) and terminal.
Simple starvation is an adaptation process developed during our evolution – starvation was a normal part of life of former generations (unlike today – try to remember the last day without a single meal). Its principle is based on a decrease in energy expenditure, saving of proteins and carbohydrates (glucose) and utilization of lipids (FA or ketone bodies). Insulin levels fall. Simple starvation is a well treatable condition, usually it is sufficient to supply high-quality food (if possible).
Before we take a look at the various stages of starving, we describe the storage compounds of the human body that can be burned during a starvation.
Human body stores energy mainly into two storage compounds – triacylglycerols and glycogen. TAG are much better – 1 g of an anhydrous TAG contains 6 times more energy than 1 g of hydrated glycogen. By a complete oxidation of 1 g of TAG we can gain 38 kJ (9 kcal). From 1 g of carbohydrates or proteins we get only 17 kJ (4.1 kcal).
We can not say that protein stores energy, because each protein degradation “harms” our body. However, muscle proteins and some plasma proteins (e.g. albumin) can be considered as “storage proteins” – these are broken down during the fasting first.
Overall, man with 70 kg enters a starvation with:
1) 400 000 kJ TAG (about 10.5 kg, accounts for 15 % of the body weight)
2) 100 000 kJ in proteins (muscle)
3) 2500 kJ in liver glycogen. Muscle glycogen adds more than 5000 kJ – total amount of energy stored in glycogen is approximately 8000 kJ
4) 170 kJ in glucose
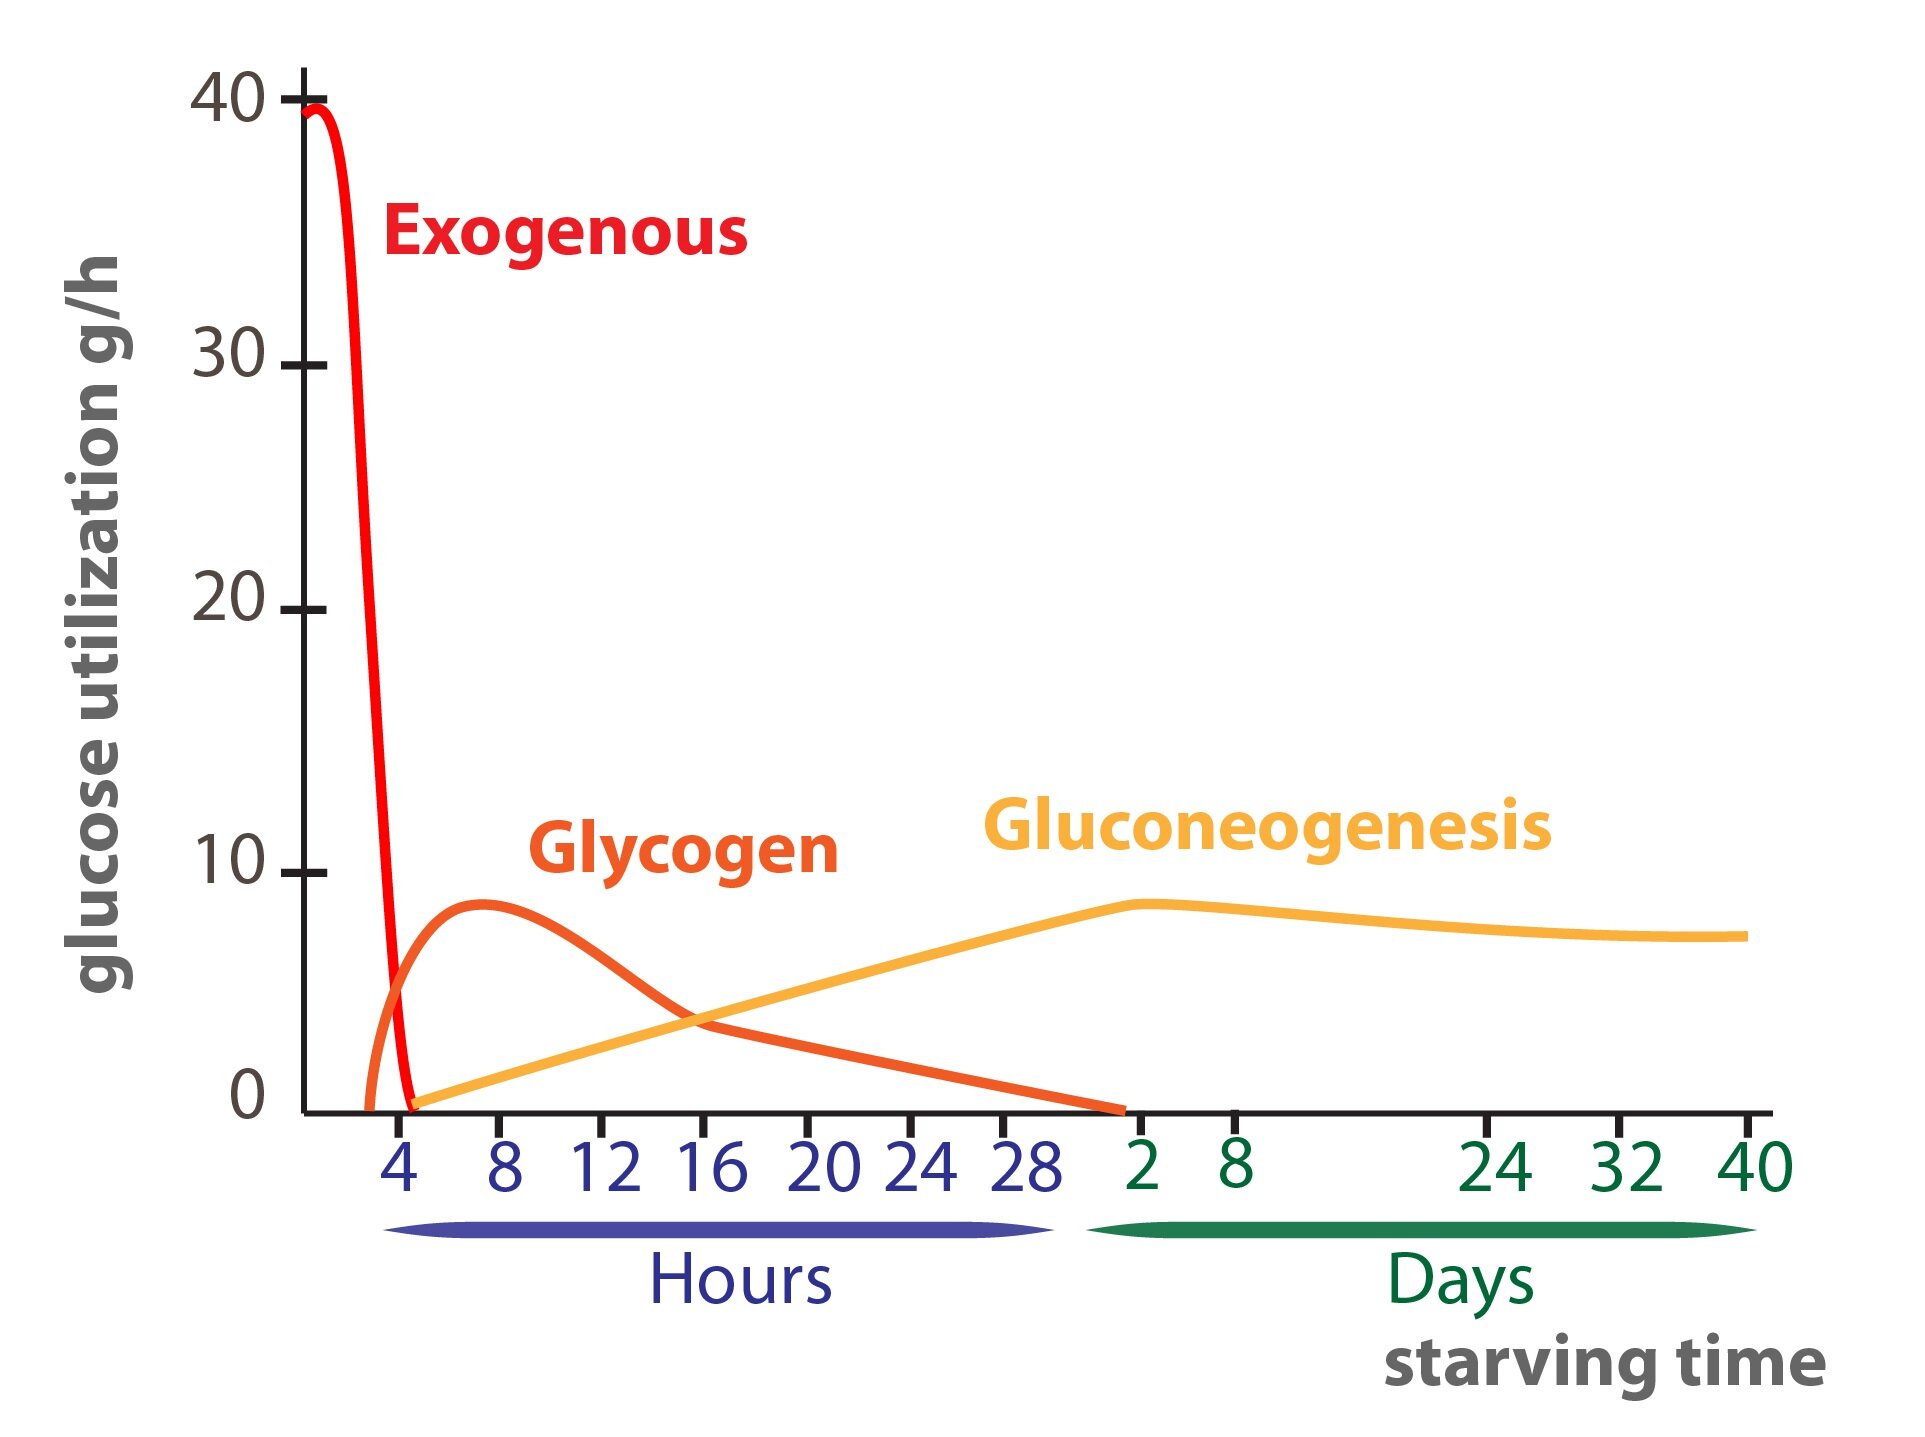
Our body consumes about 2,000 calories a day – liver glycogen and glucose can generate energy up to one day, TAG are able to cover these needs for weeks.
The fasting state is characterized by a reduction of the insulin / glucagon ratio (insulin level decreases, ↑ glucagonemia). Formation of thyroid hormones is decreased (reduces the daily basal energy requirement by up to 25 %). None nutrients come from the intestine that would cover the energy requirements of the cells. Our body enters a catabolic metabolism.
The early stage of simple starvation (takes 2-3 days)
Metabolism of saccharides (glucose)
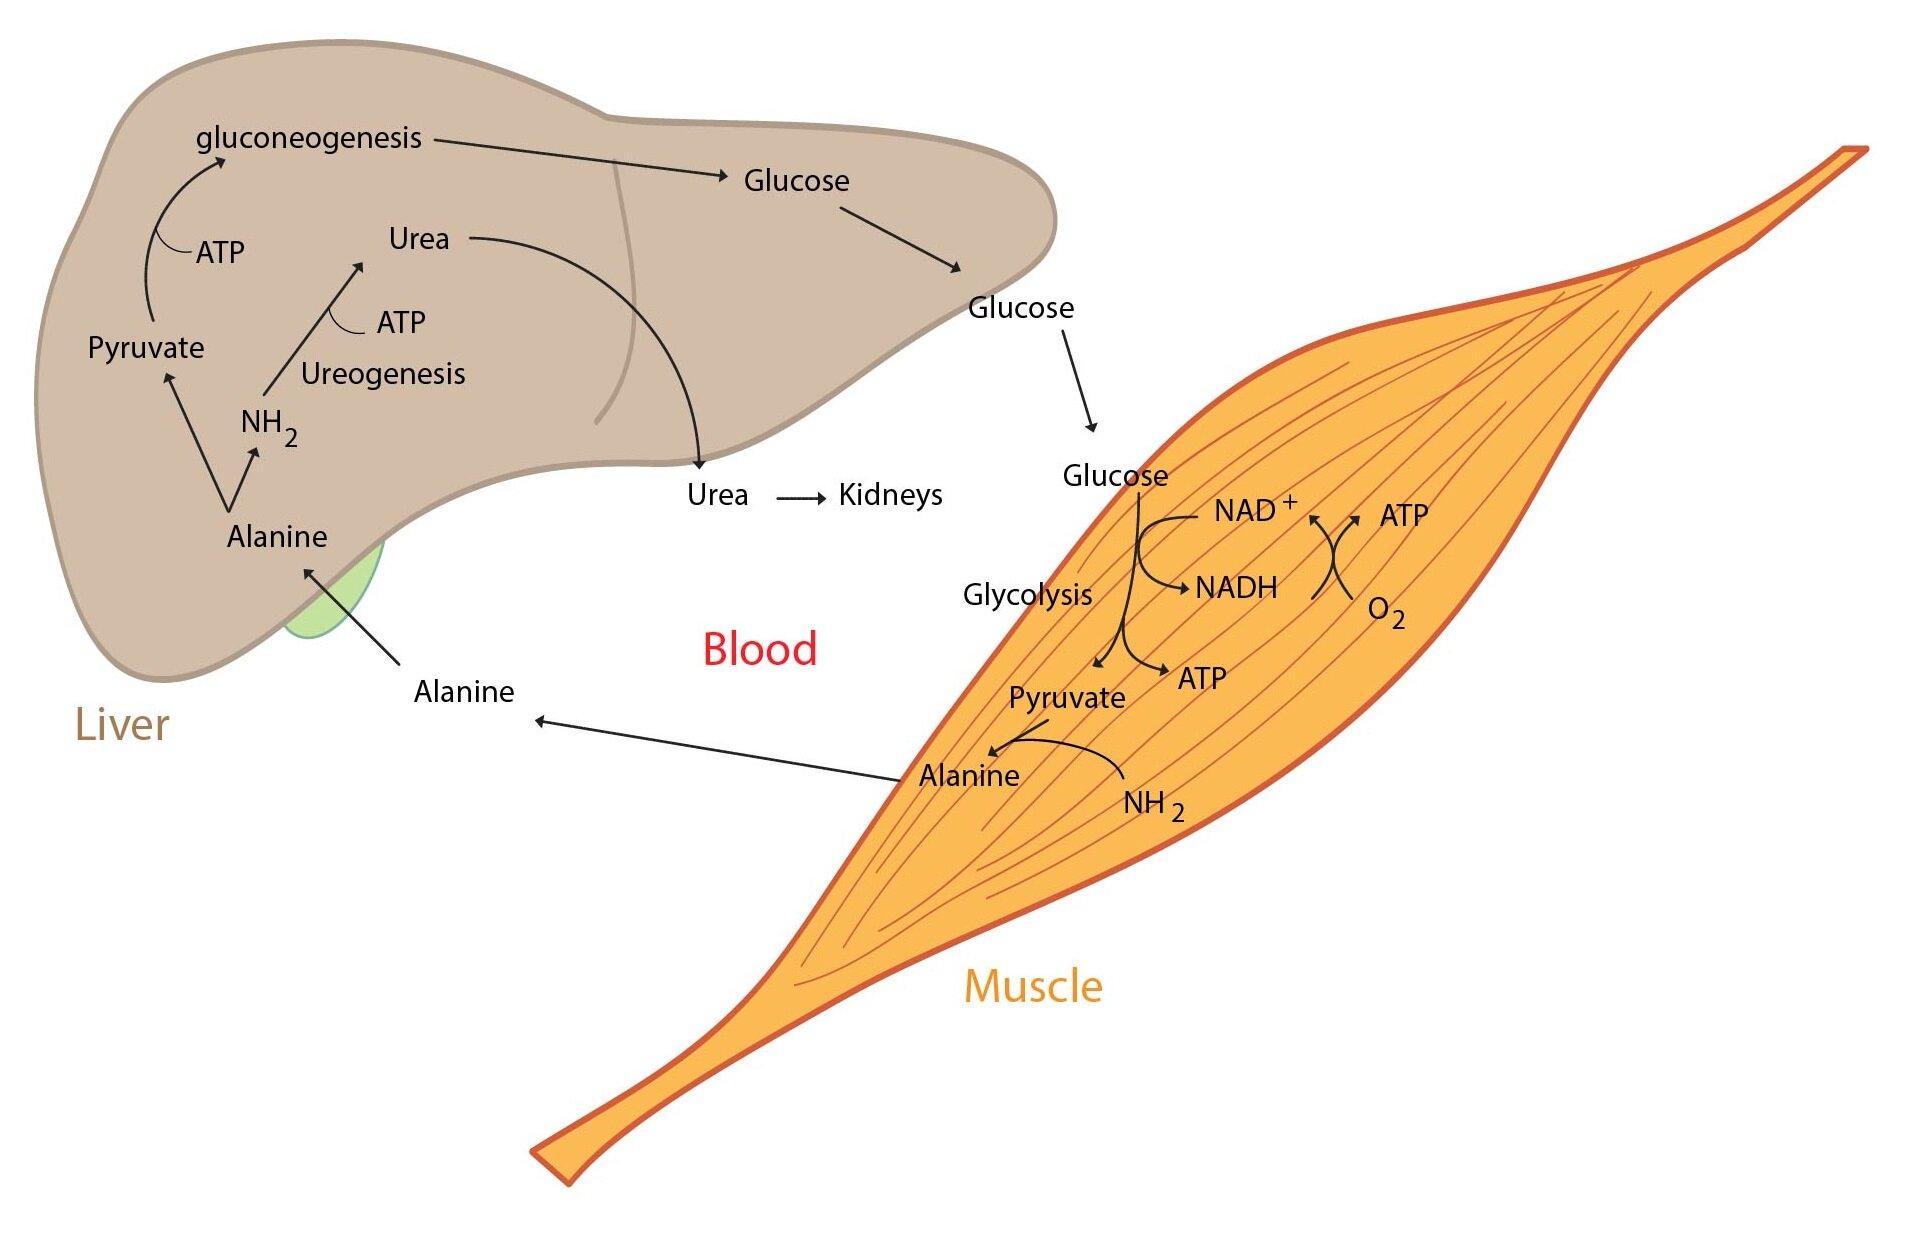
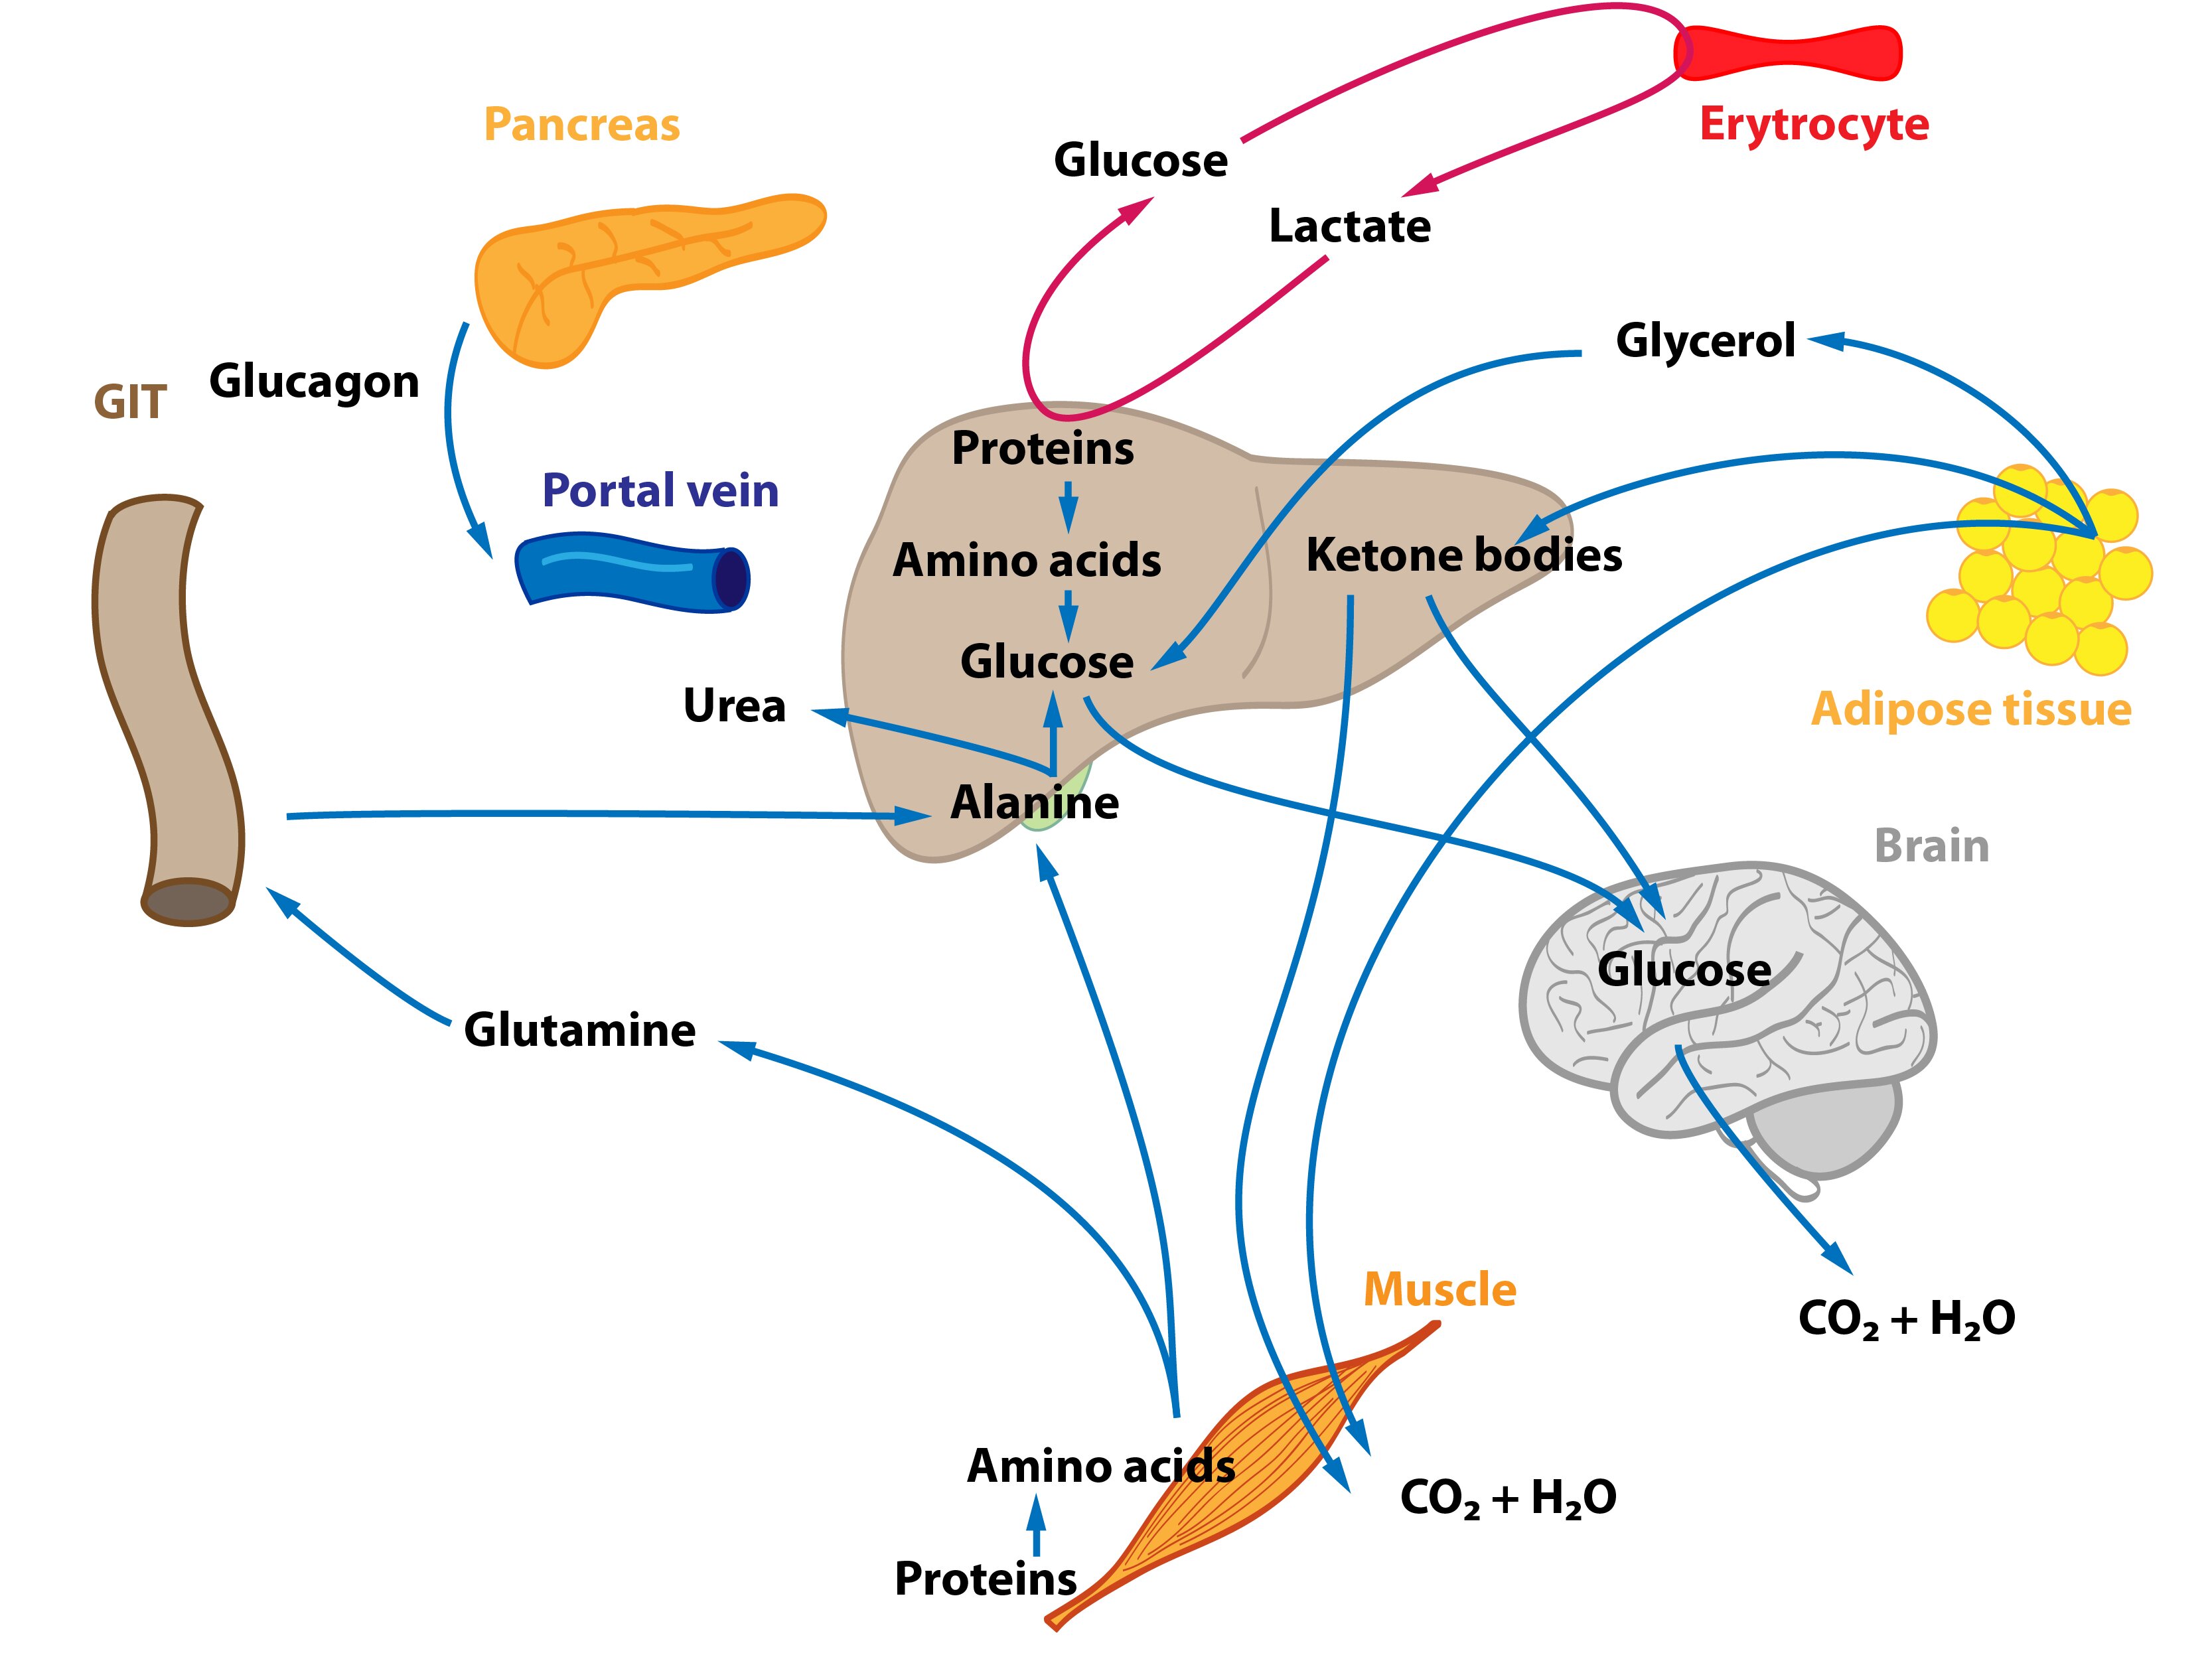
When the organism is starving for many hours and liver glycogen reserves are dwindling, hepatocytes begin to produce glucose from non-sucrose substrates (lactate, glucogenic amino acids, glycerol) – gluconeogenesis. This ensures the supply of glucose to the tissues strictly dependent on it. The importance of Cori and alanine cycle increases but they are not a source of new C atoms.
Metabolism of amino acids and proteins
Proteins, especially those from skeletal muscle, supply the majority of carbon atoms required for gluconeogenesis. The intensity of proteolysis in muscles increases. Muscle cells metabolize majority of amino acids to pyruvate and α-ketoglutarate immediately, only two amino acids (Ala and Gln) are released in large quantities into the blood. Branched amino acids serve as a nitrogen source for the production of Ala and Gln in the muscle. Released glutamine is used by enterocytes (can convert it to alanine) and lymphocytes (can metabolise it to aspartate). This process is called glutaminolysis. Amino nitrogen is detoxicated by urea synthesis in the liver.
Lipid metabolism
Lipids are the main source of energy during fasting. Due to a change in insulin / glucagon ratio lipolysis is activated in adipocytes (hormone sensitive lipase). This increases the level of fatty acids and glycerol in the blood. Many tissues directly utilize fatty acids (e.g. muscle, heart). Fatty acid oxidation provides most of the energy required for gluconeogenesis and other energy-consuming processes in the liver. Some amount of acetyl-CoA is used for synthesis of ketone bodies (ketogenesis) in hepatocytes. They become an alternative fuel for extrahepatic tissues containing mitochondria. Even the brain begins to use ketone bodies as an additional energy source (the longer starvation, the more our brain uses ketone bodies). Ketone bodies also inhibit proteolysis and oxidation of branched AA in muscle tissue and reduce the release of alanine into circulation. Glycerol is used as a substrate for gluconeogenesis.
Adaptation Phase of simple starvation (the longest phase – takes weeks)
In general, changes that started in the first phase continue. The main energy substrates are fatty acids and ketone bodies. Amount of ketones used to cover needs of the organism increases (e.g. higher utilization in the CNS). Pyruvate, lactate, amino acids and glycerol are used to maintain gluconeogenesis.
Terminal phase of simple starvation (after 7-8 weeks of complete starvation)
Organism runs out of the TAG supplies, massive protein catabolism occurs – a progressive loss of muscle mass and significant suppression of immune function.
Just after a meal
After a meal the insulin / glucagon ratio starts to increase again (↑ insulinemia). Metabolism slowly returns to an anabolic stage.
Lipids are metabolised the same way as in well-fed state. Metabolism of carbohydrates on the other hand persists for some time in the “semi-starving“ mode – activation of liver continues. Gluconeogenesis provides glucose molecules dominantly for the synthesis of liver glycogen to replenish its stores. However, in peripheral tissues glucose molecules are catabolized by the normal way. After some time the rate of liver gluconeogenesis decreases and glycolysis begins to dominate – we call it the „glucose paradox“. Glycogen is refilled in muscles also and TAG are synthesized in adipose tissue. Amino acids are used primary as a source of carbon atoms for the gluconeogenesis, secondary proteins are synthesized from them (in liver and other tissues).
Glutamine metabolism
Glutamine represents ammonia in several metabolic pathways – in detoxification of amino group (transport of -NH2, urea cycle) or in synthesis of nucleotides. Citrulline is synthesized from glutamine also – another connection with the urea cycle. Glutamine is an important energy substrate for rapidly dividing cells – such as enterocytes or immune cells (transformation to glutamate and α-ketoglutarate, which enters the Krebs cycle, it also serves as a donor of N in the synthesis of nucleotides).
Increase of glutamine concentration in the blood can be caused by increased intake of dietary proteins but also by the degradation of our own proteins.
_
Physical activity
We can differentiate between aerobic exercise (long distance running, long training) and anaerobic exercise (sprints, weightlifting).
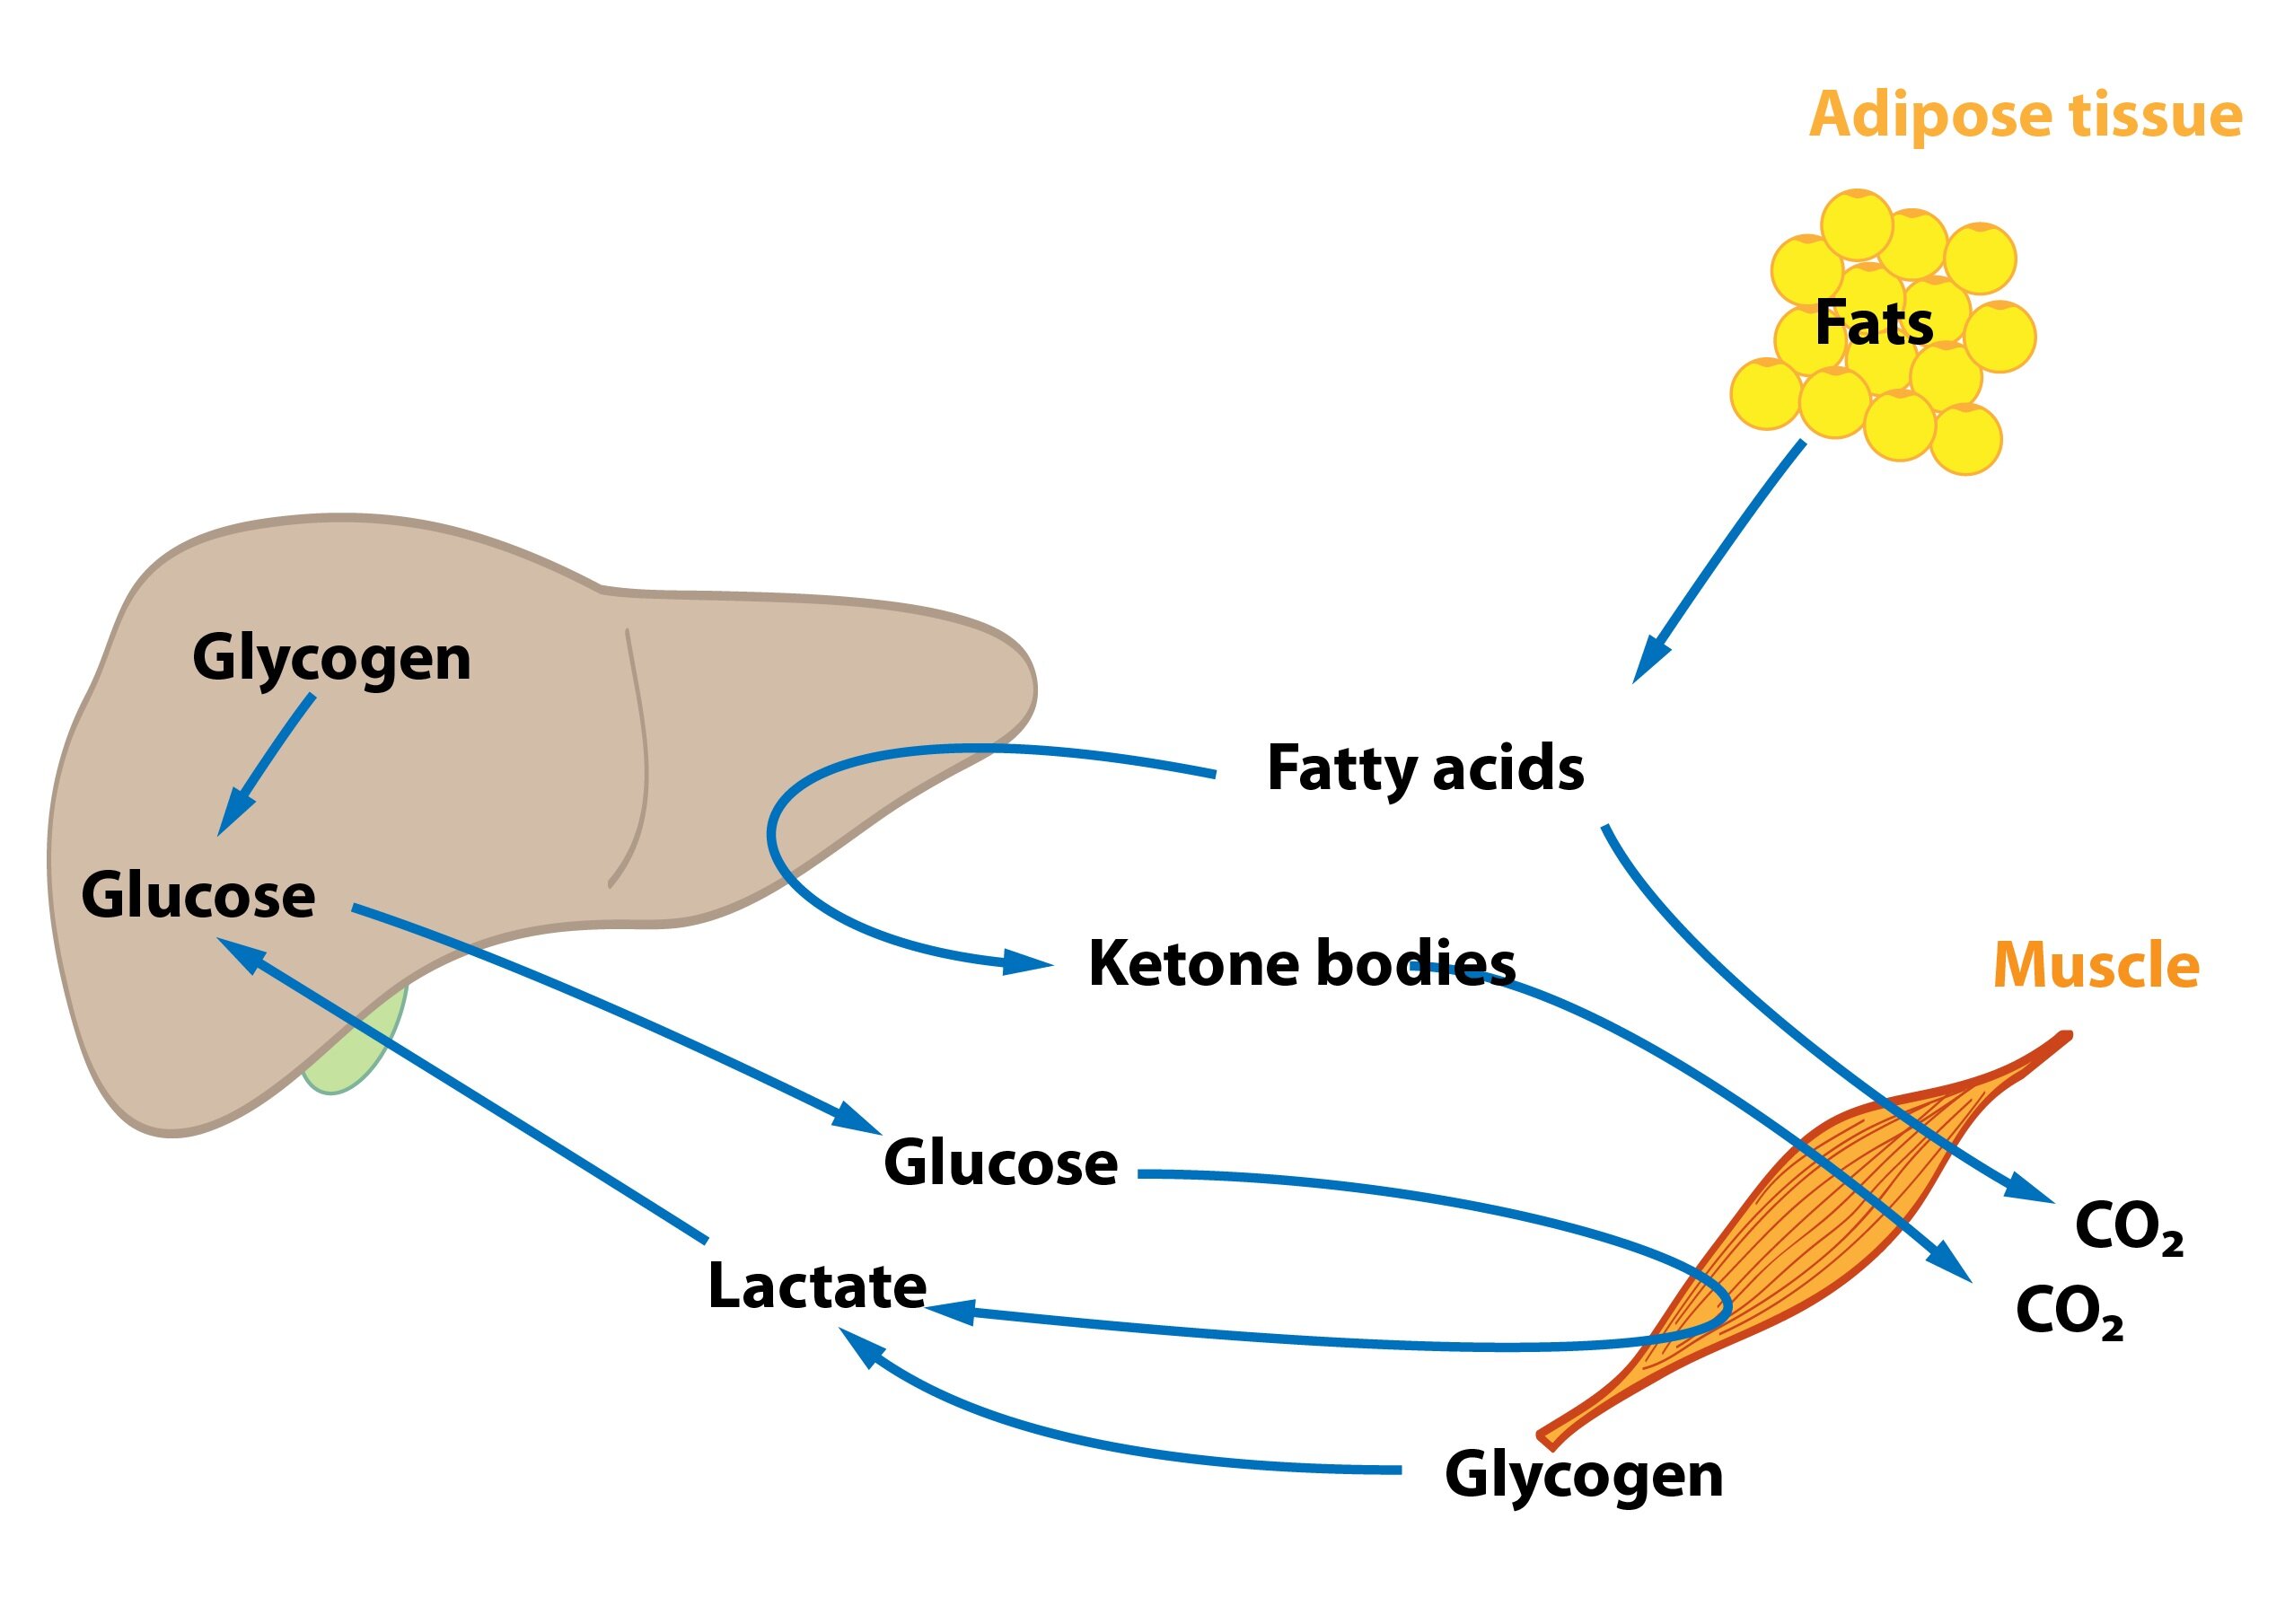
During anaerobic exercise the interorgan cooperation works minimally. Muscle blood vessels are in fact contracted during contraction – muscles are partly isolated from the rest of the organism. Muscle cells can thus rely only on their internal reserves – glycogen and phosphocreatine.
Even during aerobic exercise muscle cells gain significant amount of energy in glycolysis (glucose molecules are produced by degradation of muscle glycogen). Amount of muscle glycogen can be increased by certain ways – hard training followed by a rest with a diet with high amount of carbohydrates. But normal person doesn’t store enough glycogen to cover all energy requirements. Therefore our muscle cells use fatty acids – lipolysis is increased and muscles oxidize more fatty acids than glucose. Concentration of ketone bodies is not increased as much as during the starving. In addition, metabolism of branched-chain amino acids is stimulated.
Subchapter Authors: Petra Lavríková and Josef Fontana
![]()